


Get Started With FineBI Cloud
FineBI Cloud helps teams turn business data into analysis-ready datasets, charts, dashboards, and storyboards without writing code. You can connect data, clean and model it, build visual analysis, and share trusted insights with others in and outside your organization.
How FineBI Cloud Works
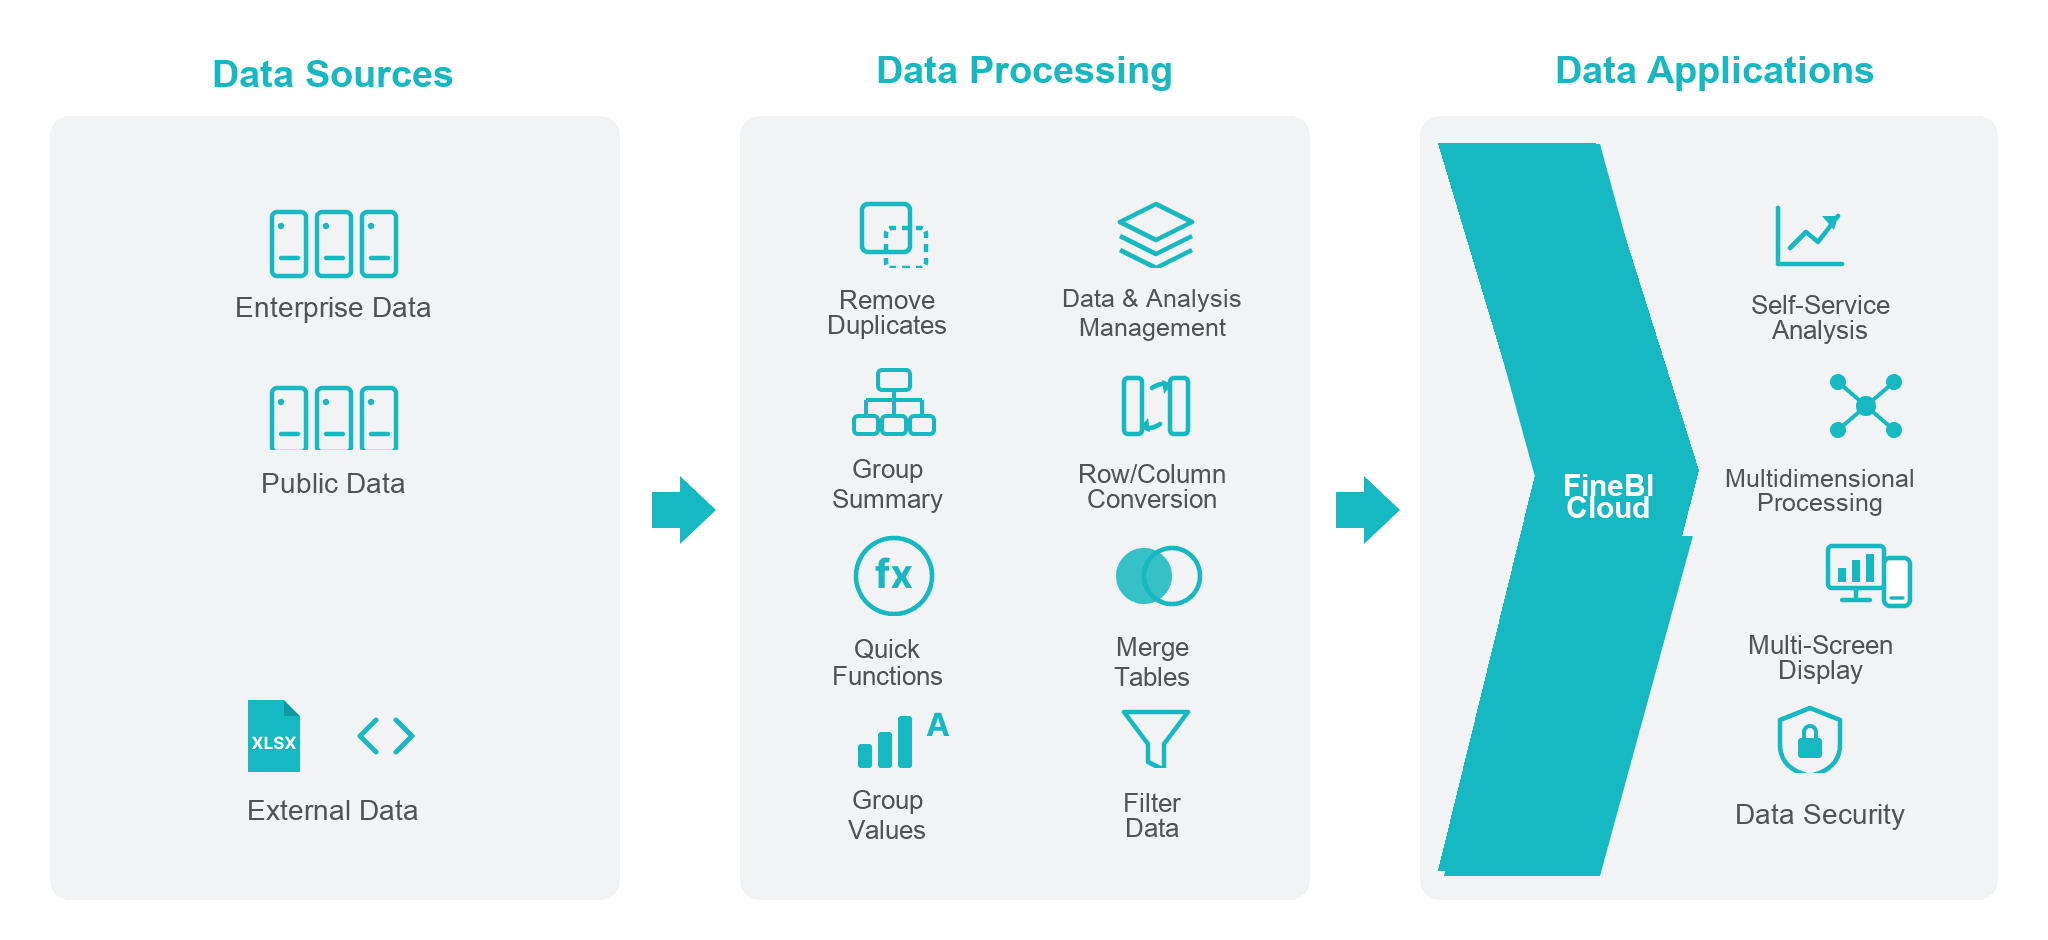
FineBI Cloud follows a simple flow: connect data sources, process the data, and use the prepared data in analysis outputs.
| Stage | What It Is For |
|---|---|
| Data Sources | Connect business data from Excel files, databases, and other supported sources. |
| Data Processing | Clean, transform, and calculate data before analysis. |
| Data Applications | Analyze prepared data and present results with charts and dashboards. |
Core Capabilities
Data Connection
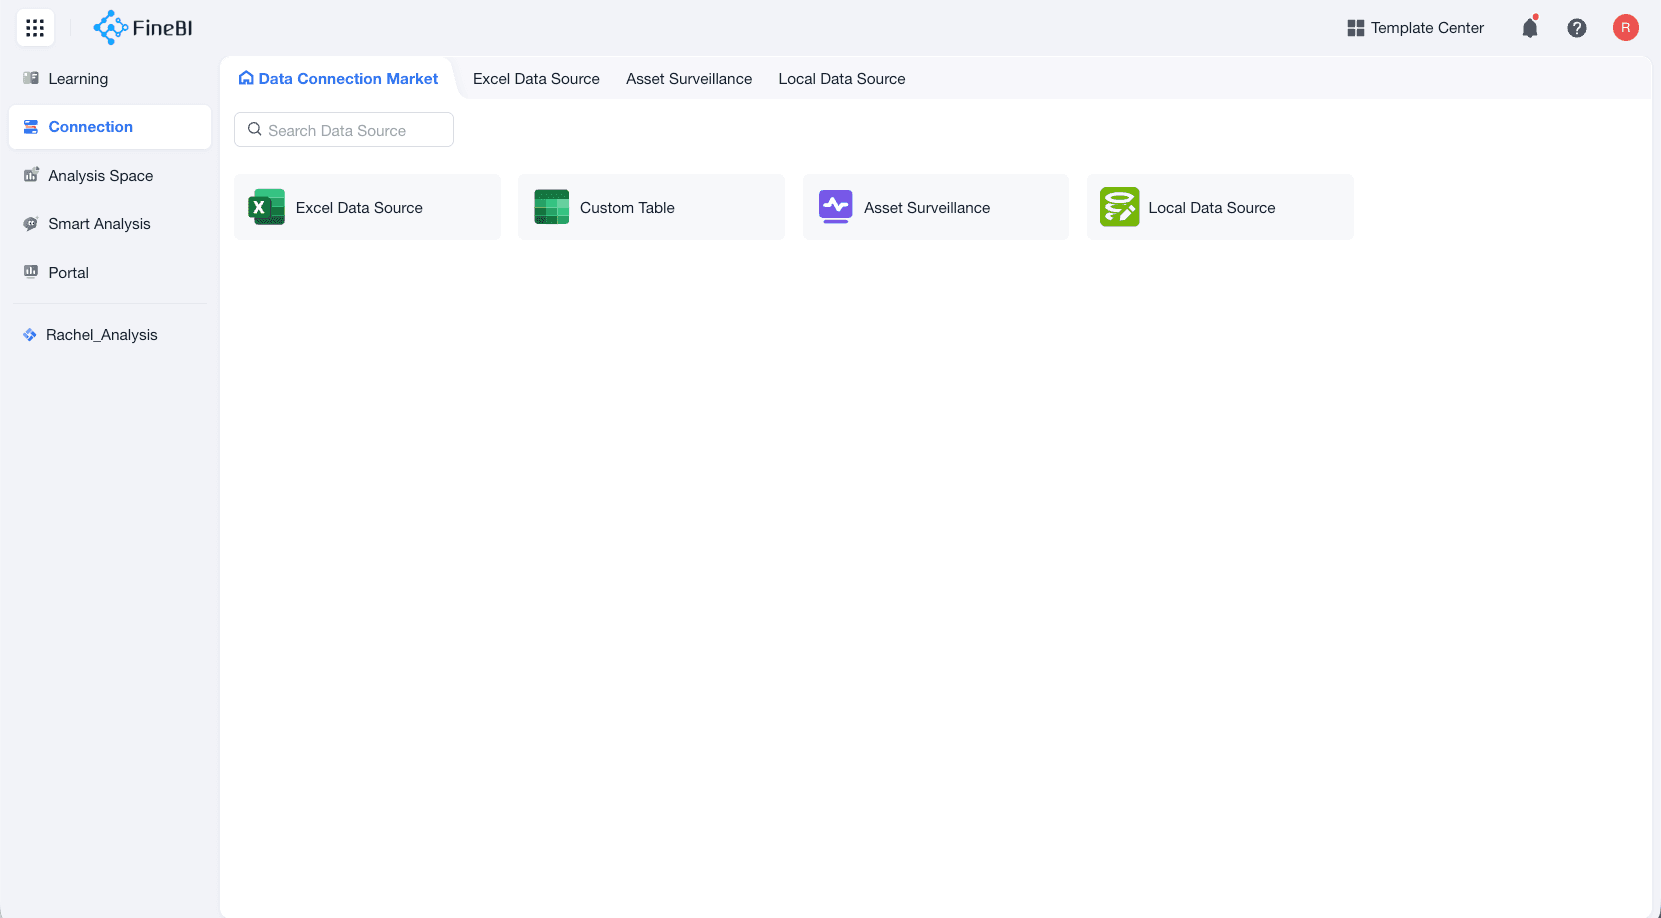
You can import or connect data from different sources and add the data to projects for analysis. A data table can be reused across multiple projects, so teams can work from shared, consistent data.
 Data Processing
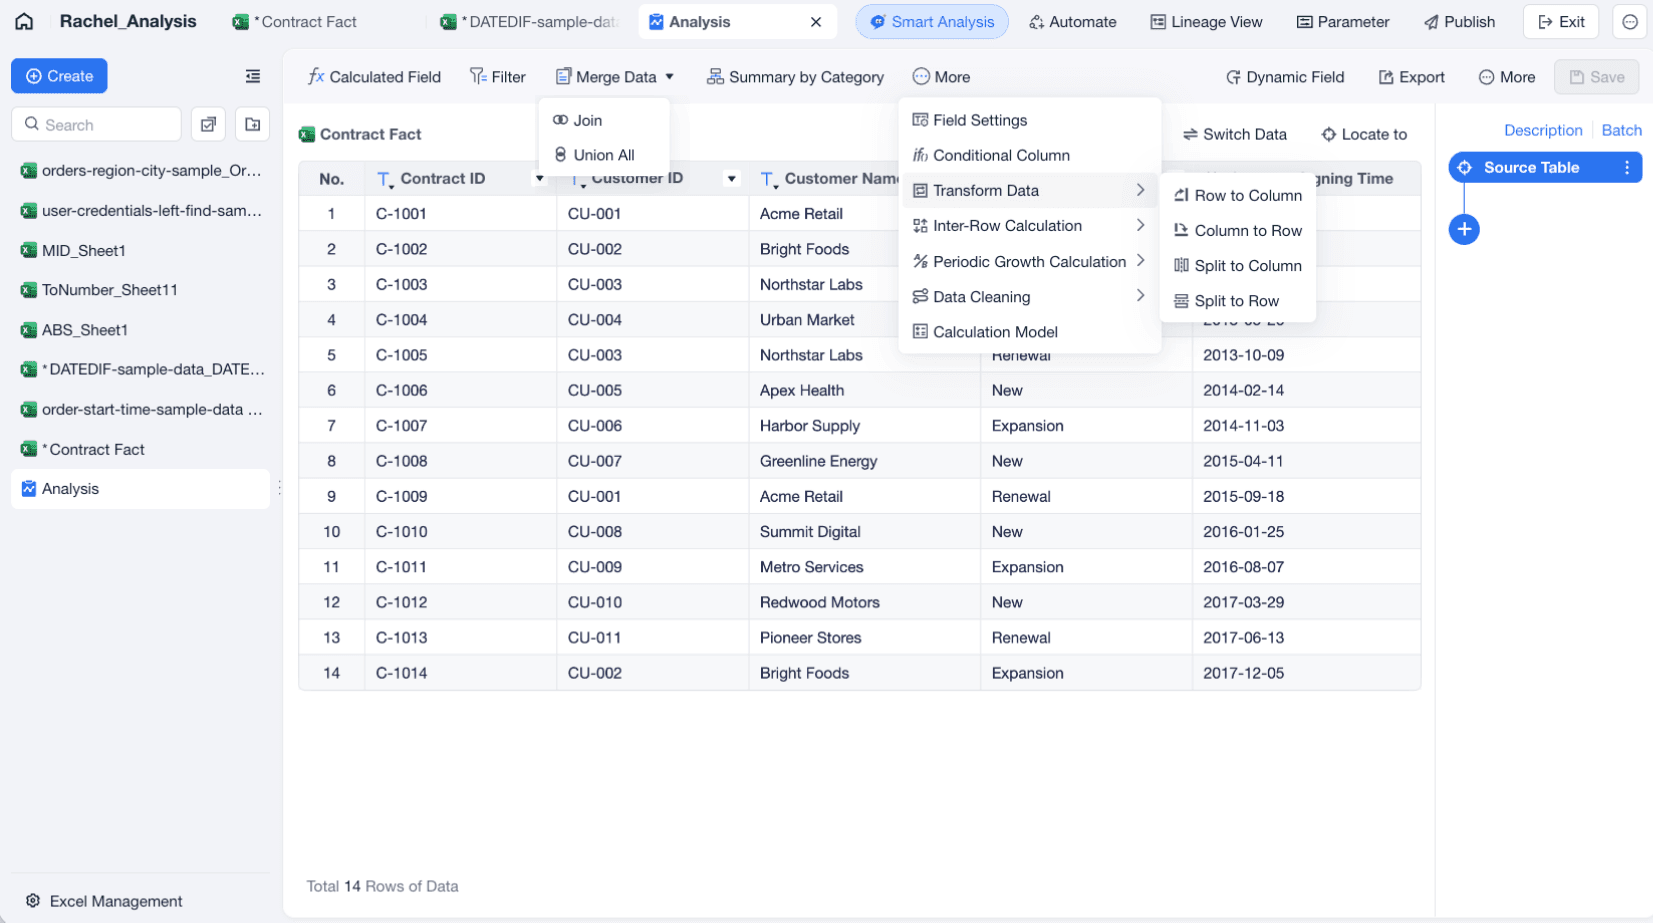
Analysis tables are where you prepare data for analysis. You can add calculated fields, summarize and group data, filter records, sort rows, perform table unions and joins, and build relationships between tables.
 Data Analysis
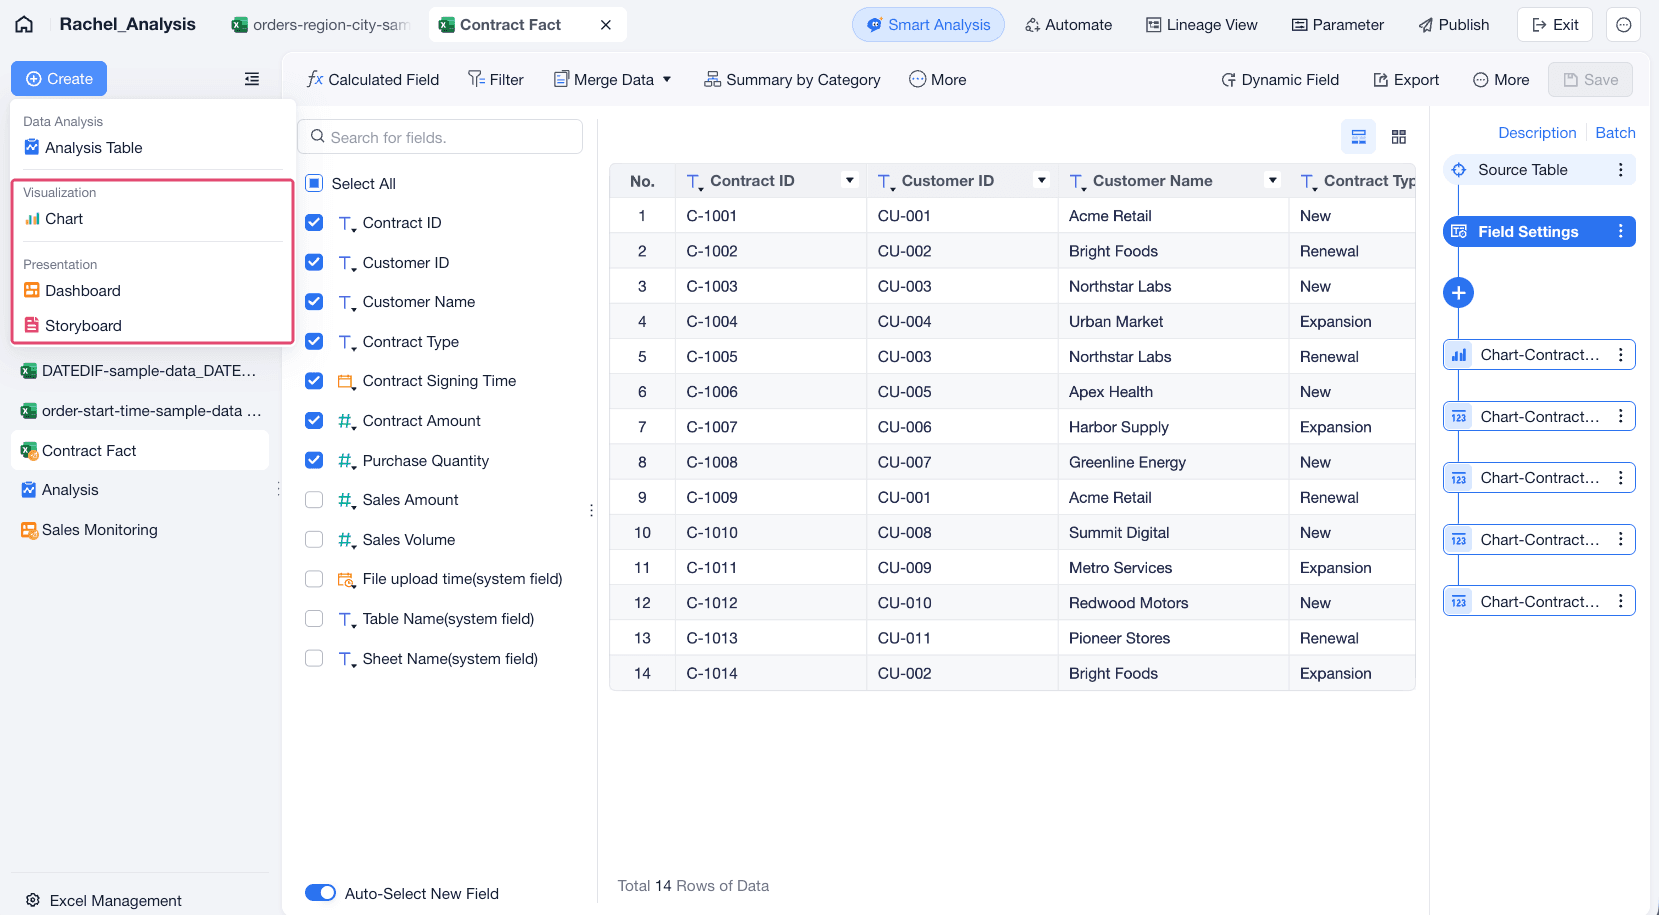
FineBI Cloud supports multi-dimensional data exploration and common calculations such as ranking, period-over-period comparison, and percentage contribution. You can present analysis results with charts, complex tables, dashboards, and storyboards.
 Data Portal
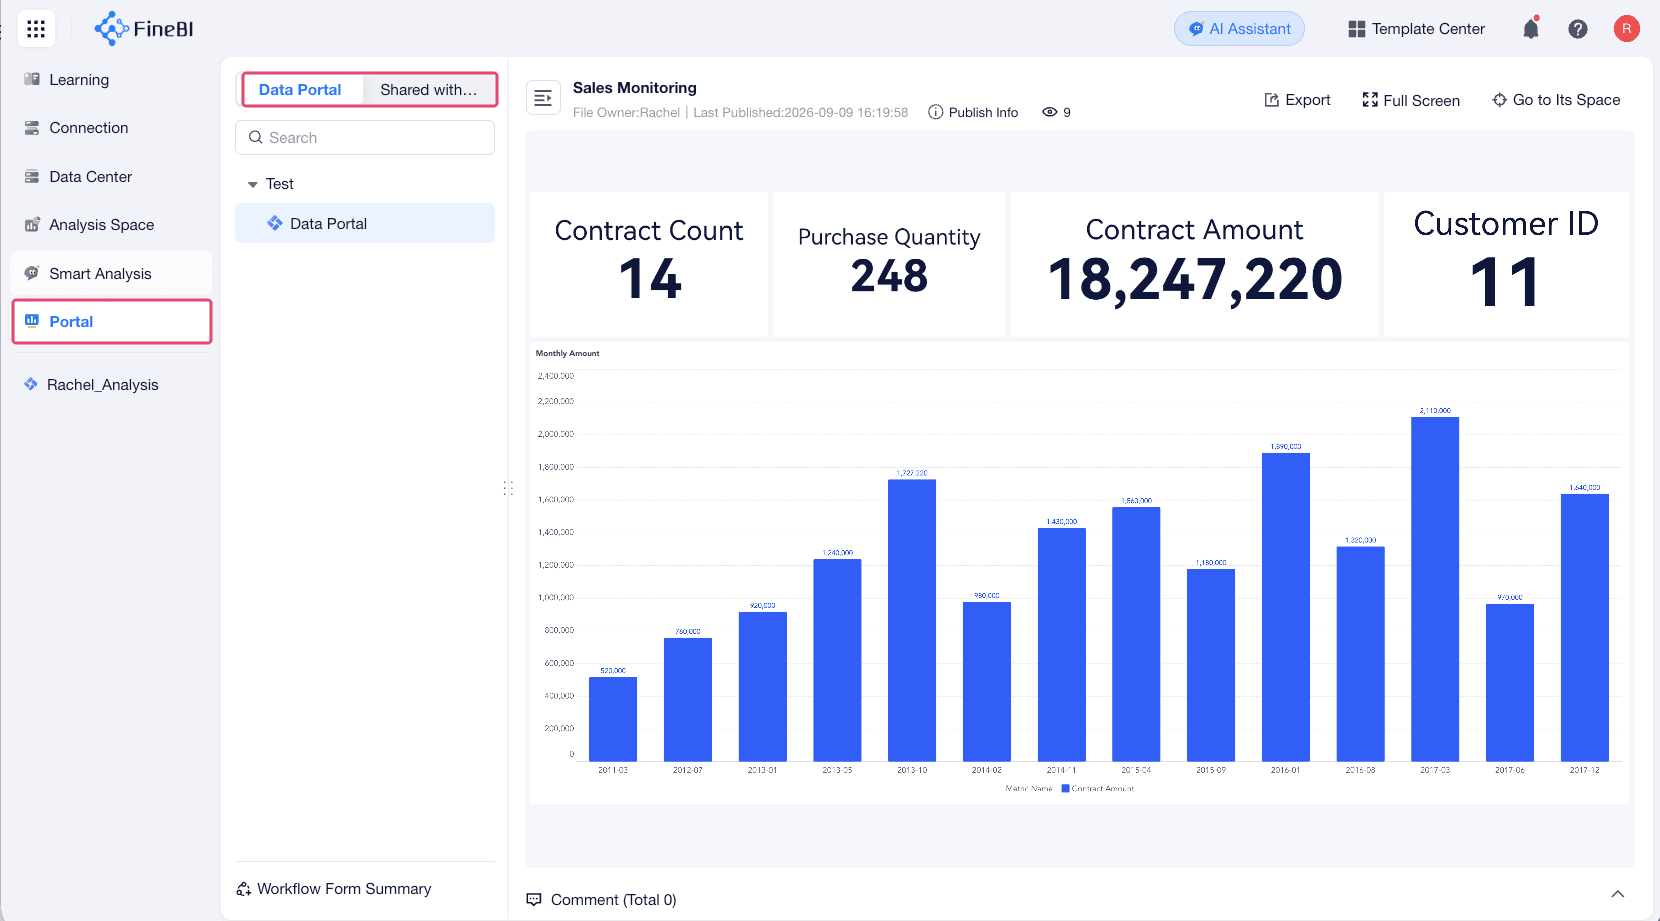
Data Portal gives your organization one place to access published dashboards and storyboards. You can share content with specific members, share based on member attributes, or create public links when external sharing is available.
Product Areas
| Product Area | What It Is For |
|---|---|
| Learning | Follow learning cards and onboarding content based on what you want to do first.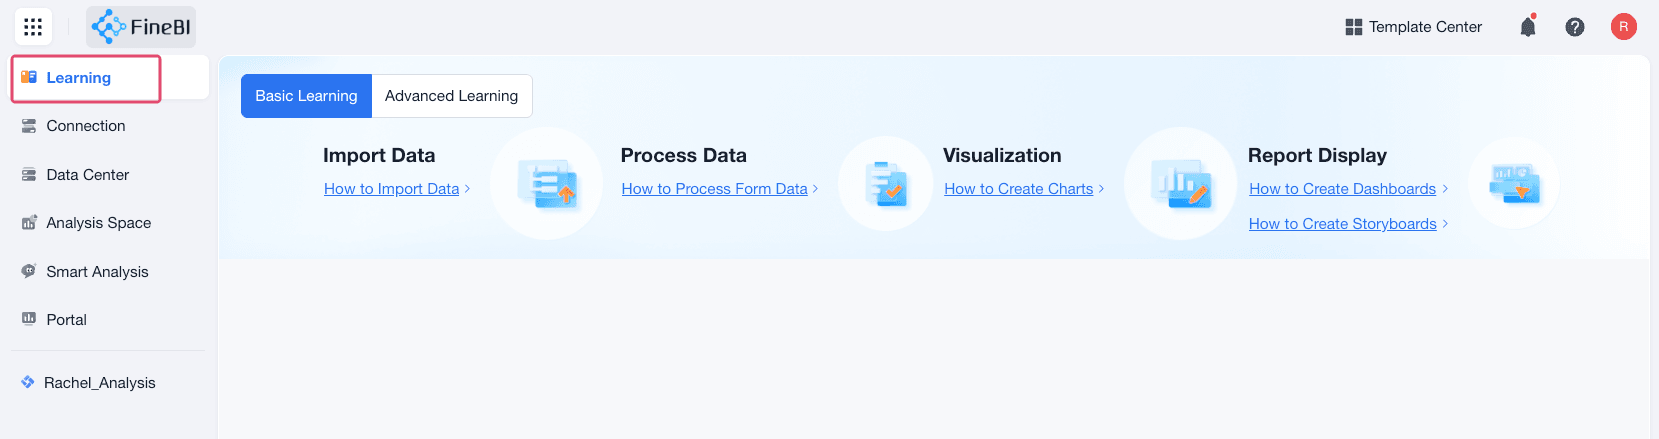 |
| Connection | Connect and manage data sources such as Excel files, databases, and SaaS app data.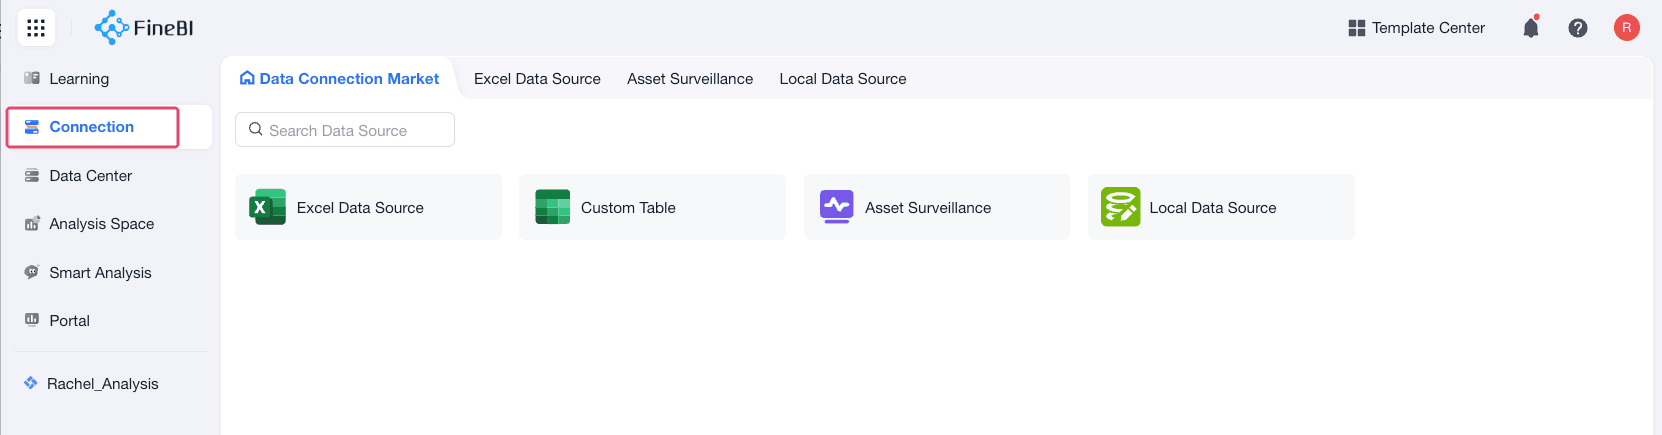 |
| Data Center | Manage data assets, configure connections, create shared datasets, and browse the data catalog.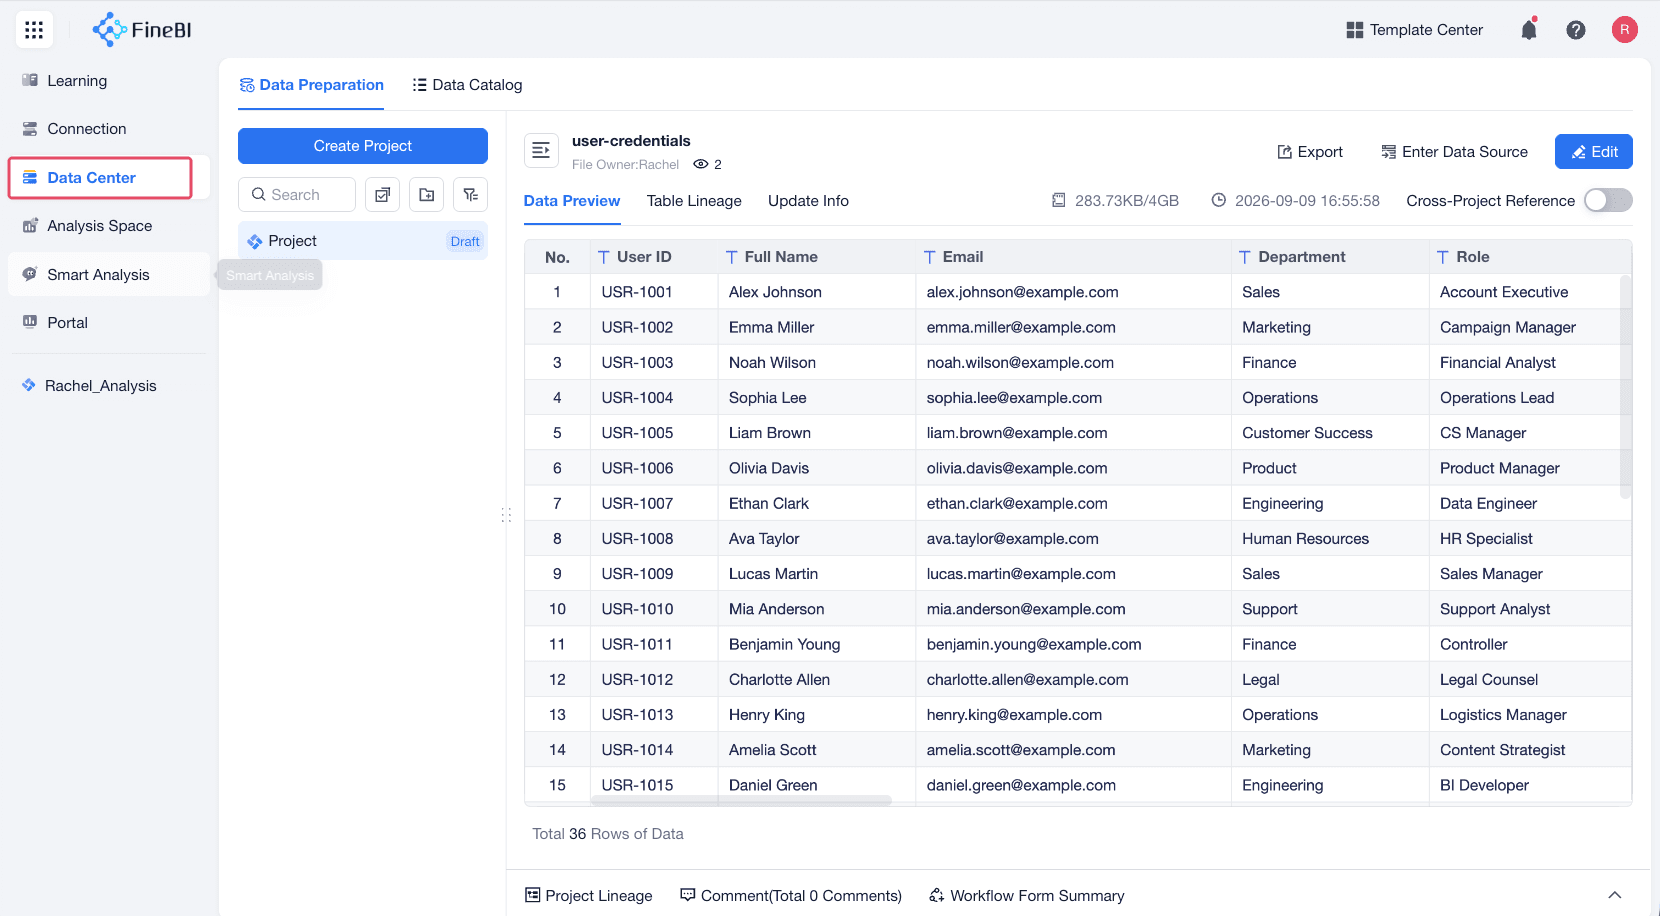 |
| Analysis Space | Organize analytics work by organization, space, and project. Use spaces to manage access and separate data by team or business area. Use projects to create and edit analysis tables, charts, dashboards, and storyboards, and to view lineage, parameter settings, and management items. 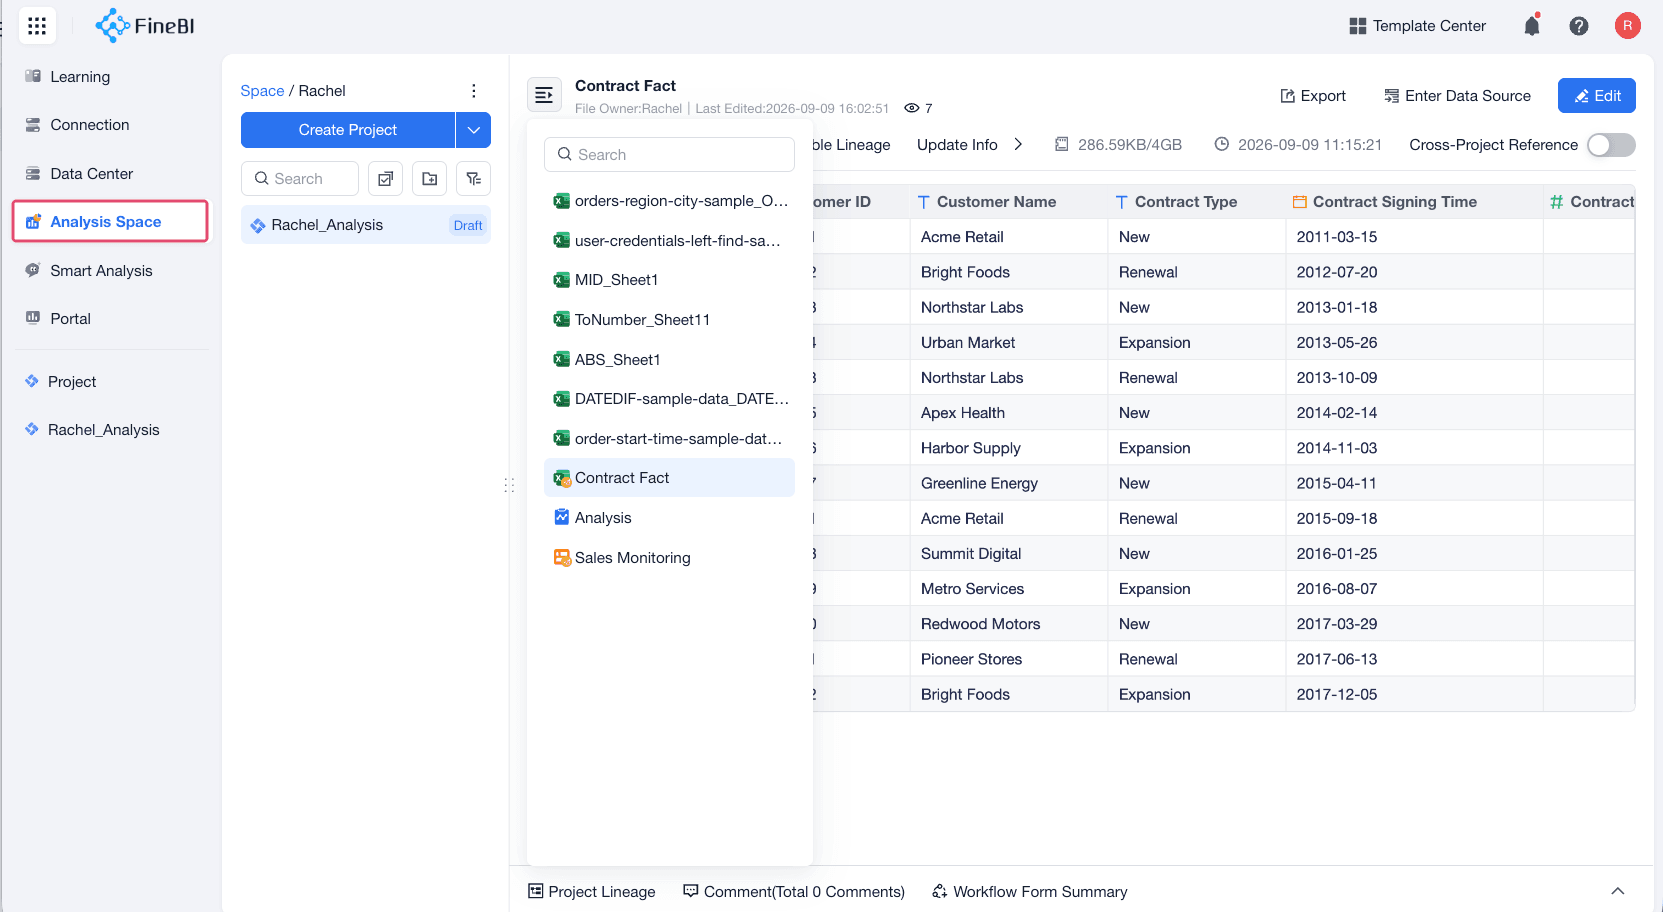 |
| Smart Analysis | Ask questions about your data and get AI-assisted insights without building analysis content from scratch.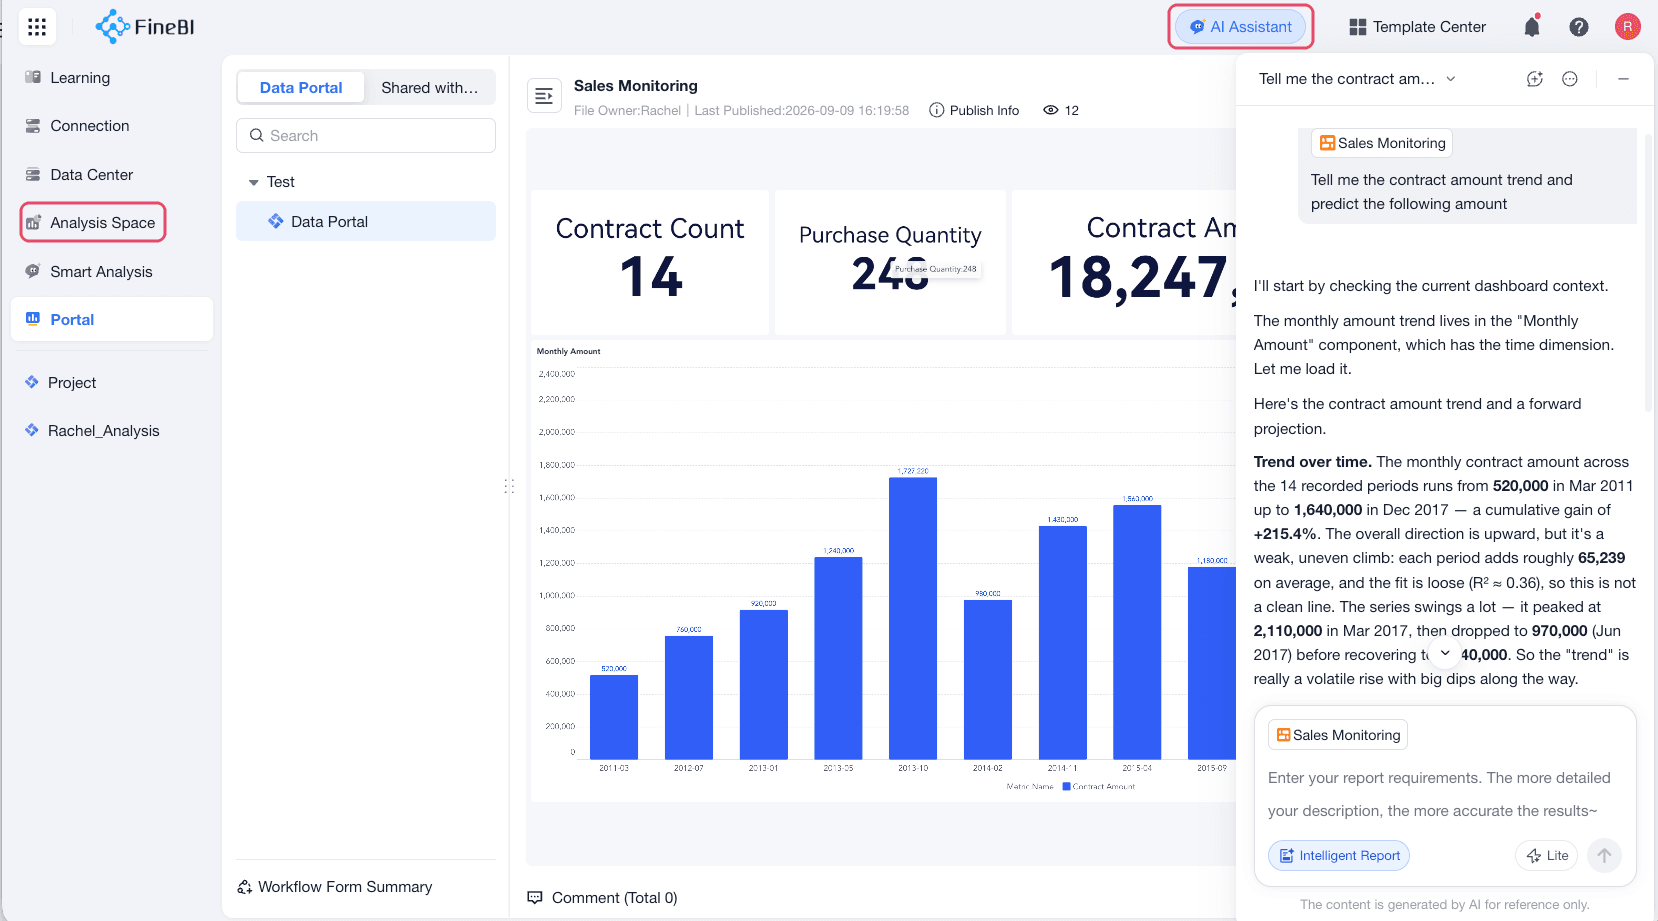 |
| Data Portal | Provide a centralized place for space members to view published dashboards and storyboards in the space. 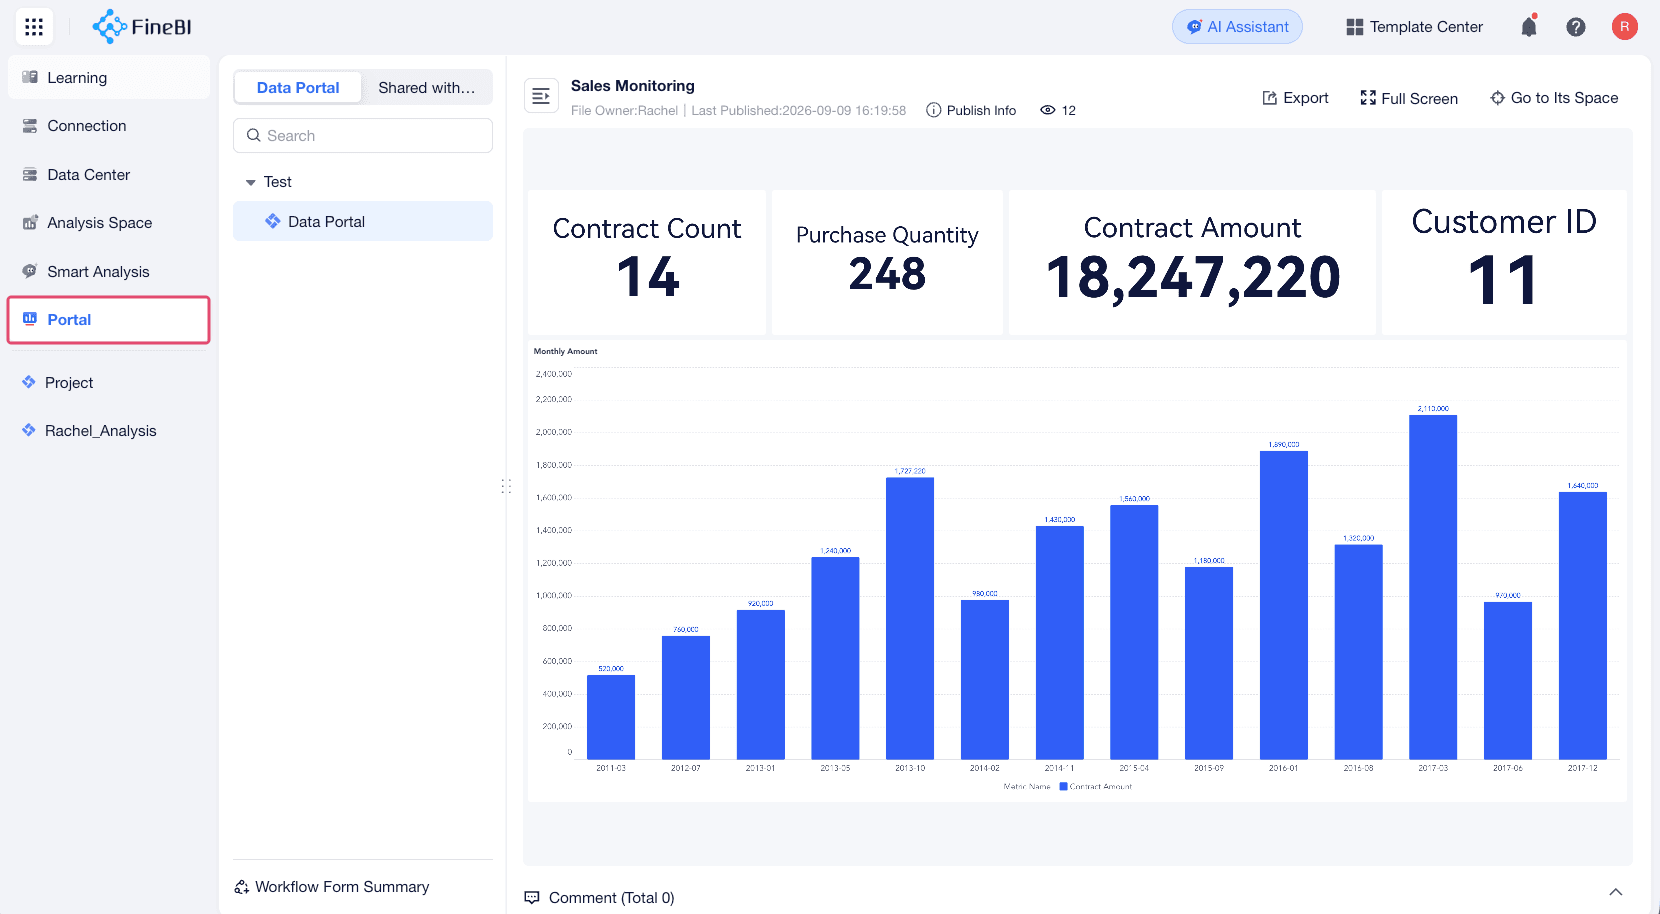 |
| Template Center | Start from prebuilt analysis templates and replace example data with your own data. 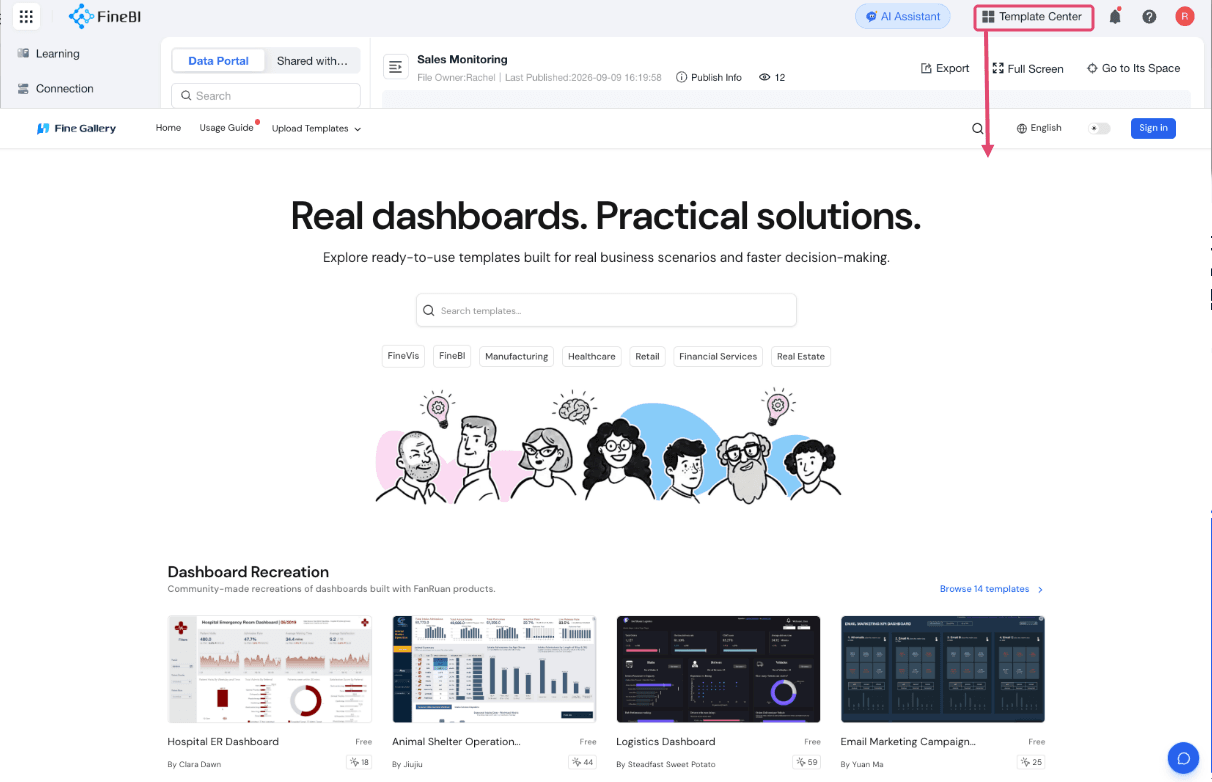 |
| Messages | View product messages, such as data source expiration notices and member changes.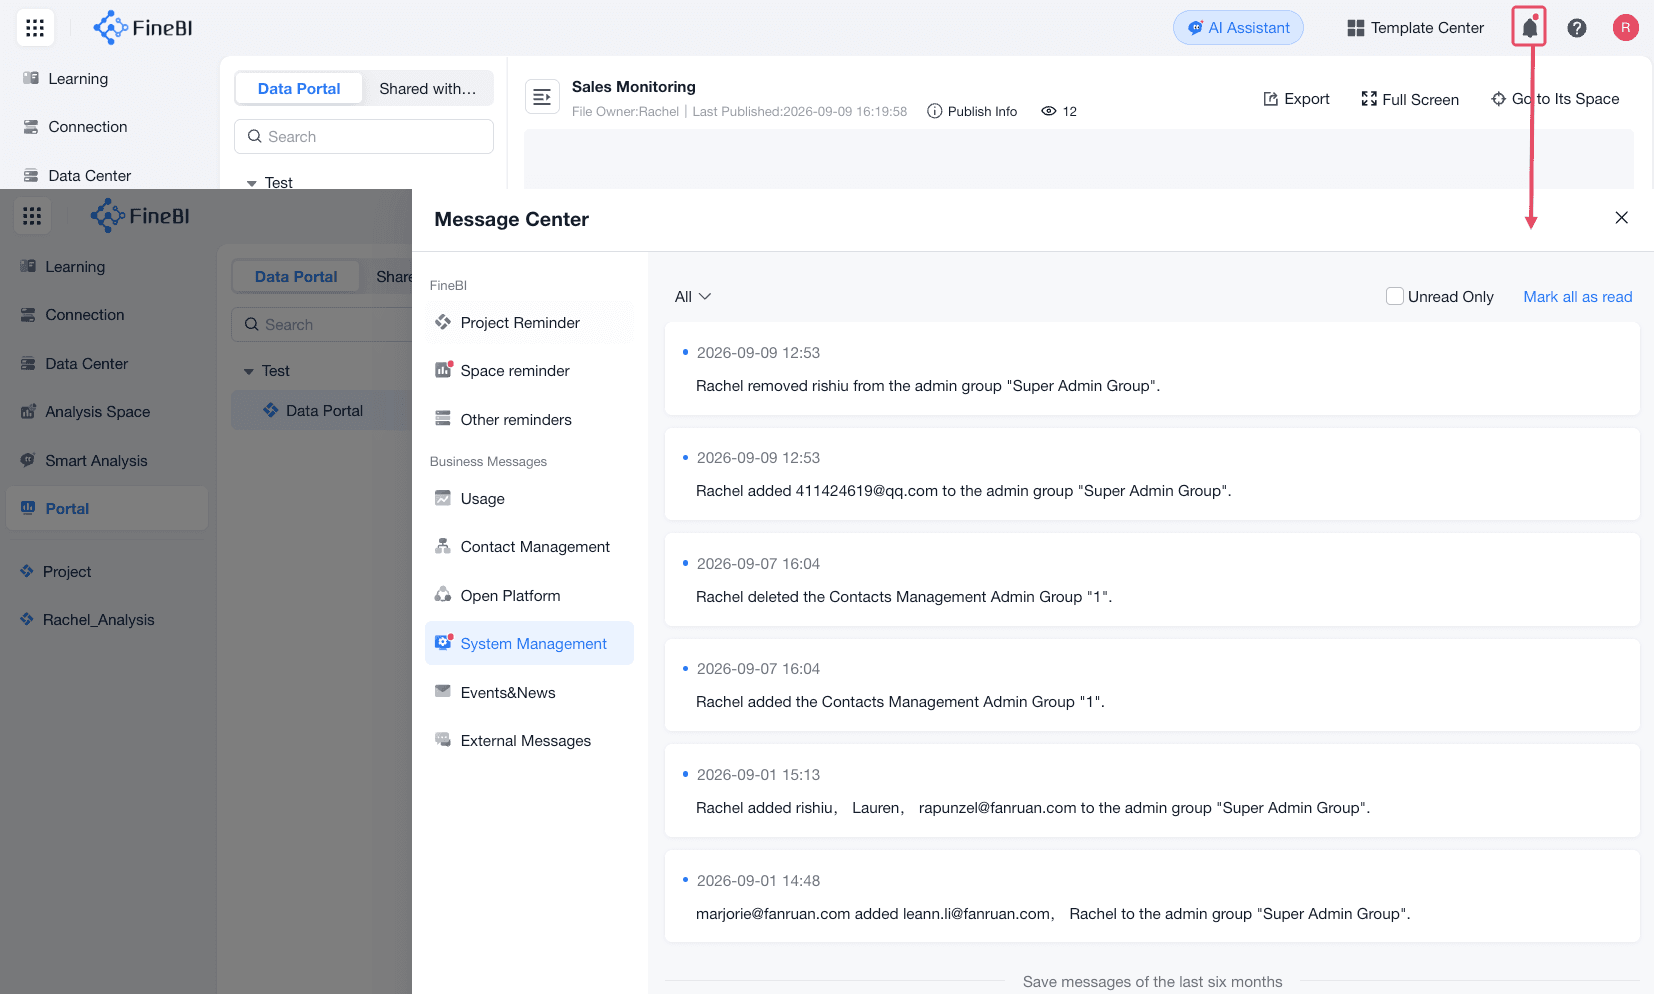 |
| Help Center | Find product guidance and troubleshooting content.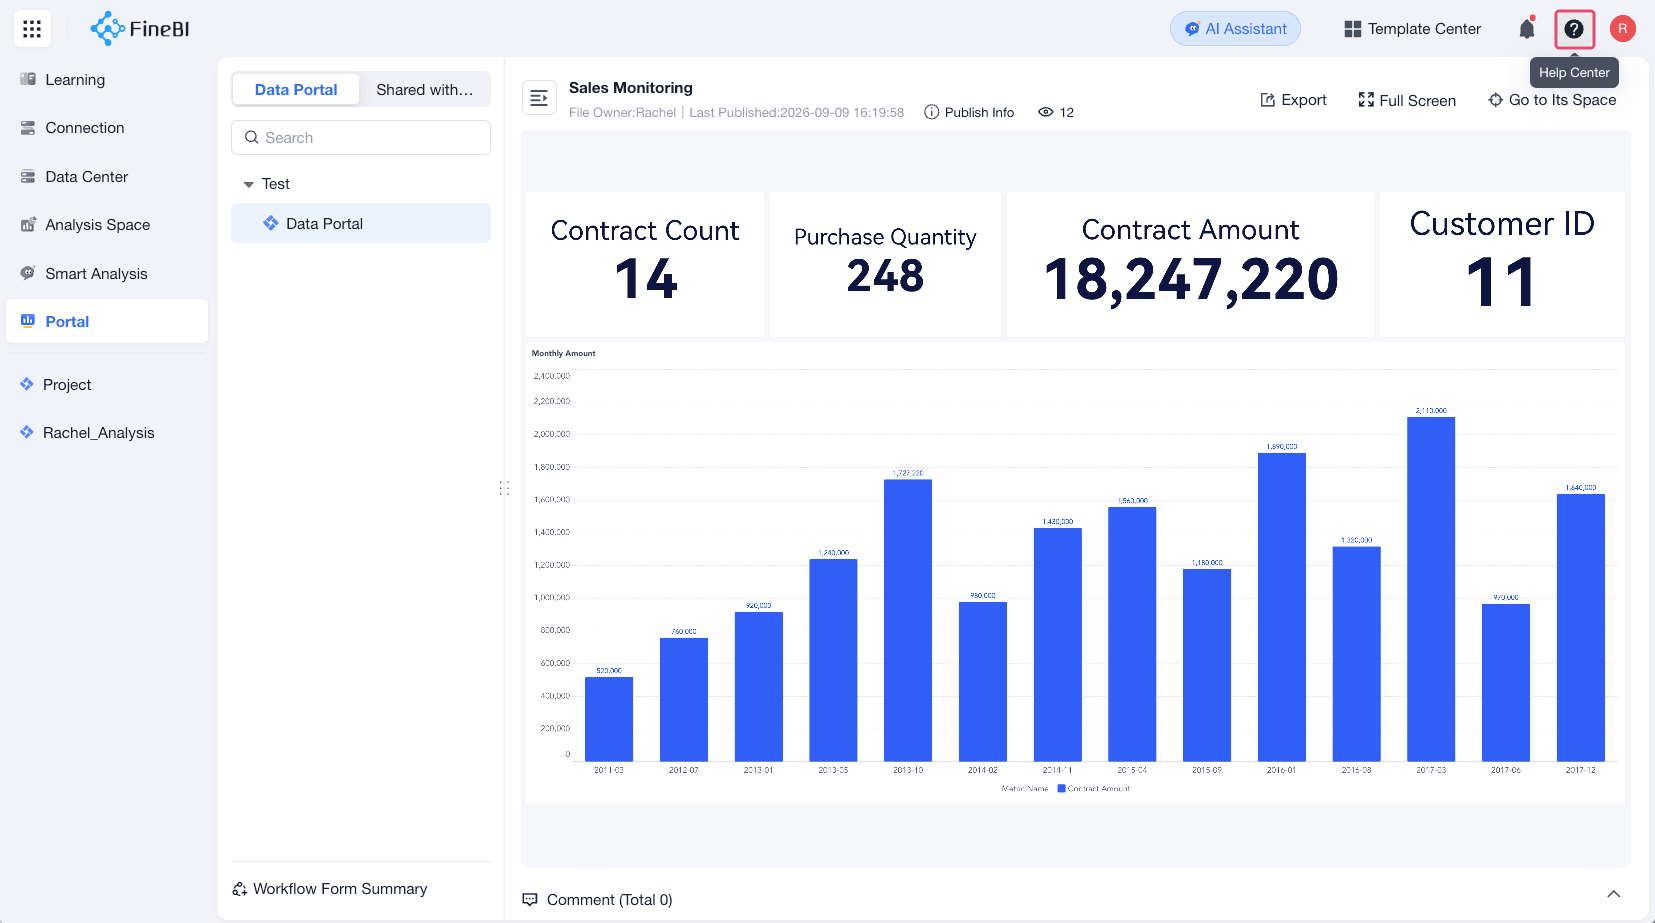 |
| Personal Settings | Manage your profile and account bindings. 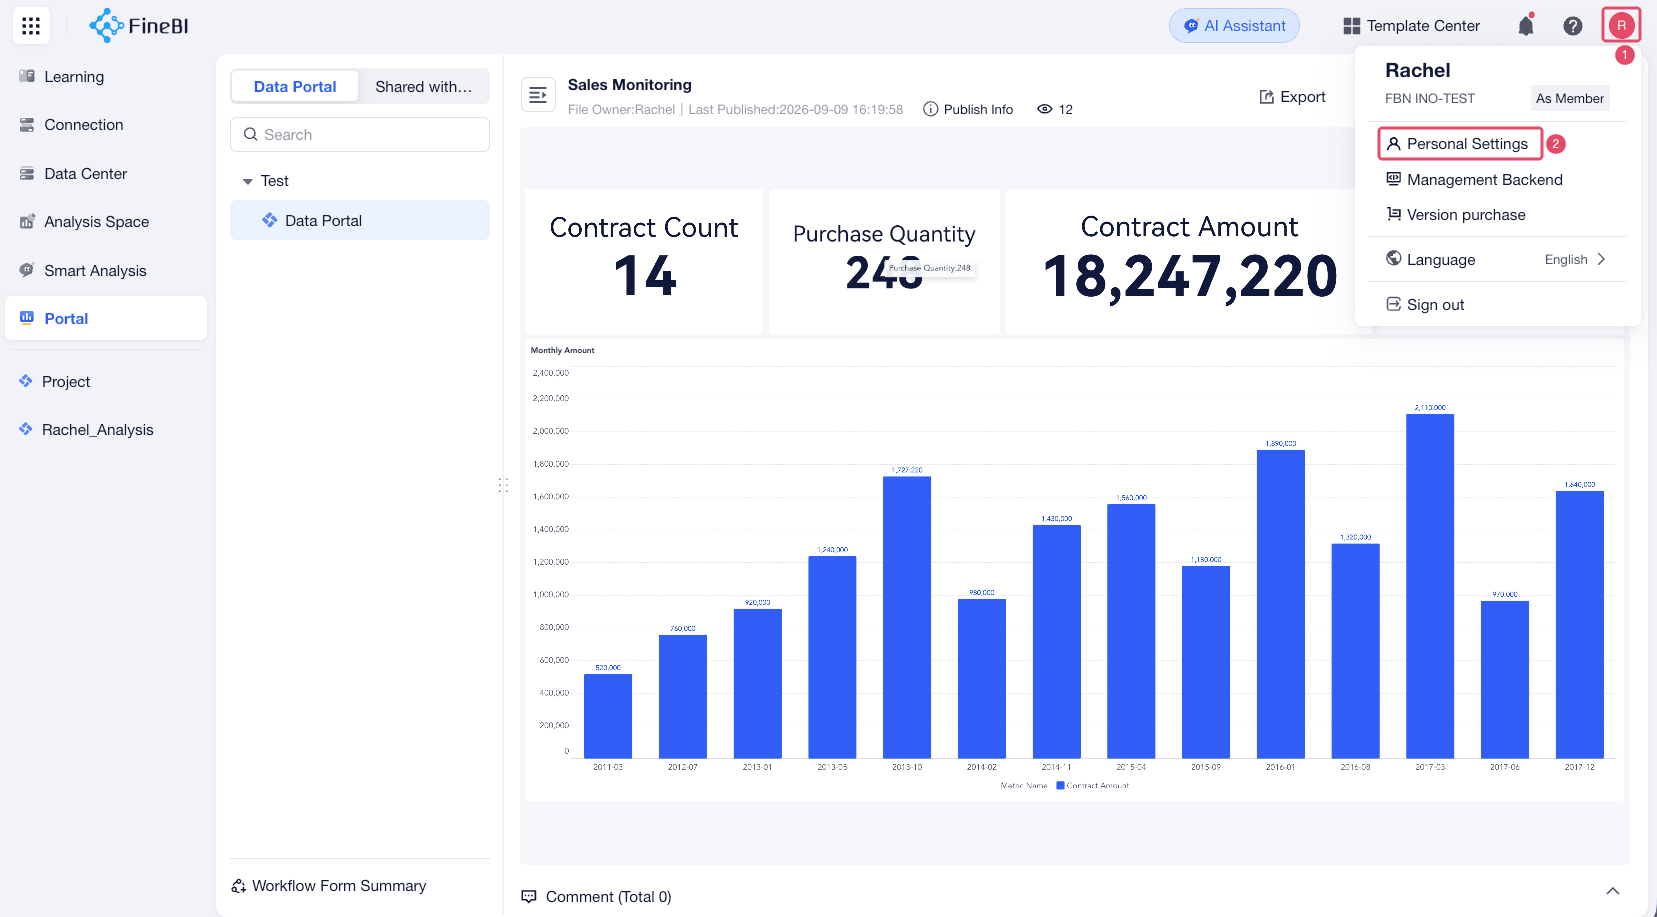 |
| Management Backend | Manage organization information, members, roles, security, data portals, schedules, and plan information. 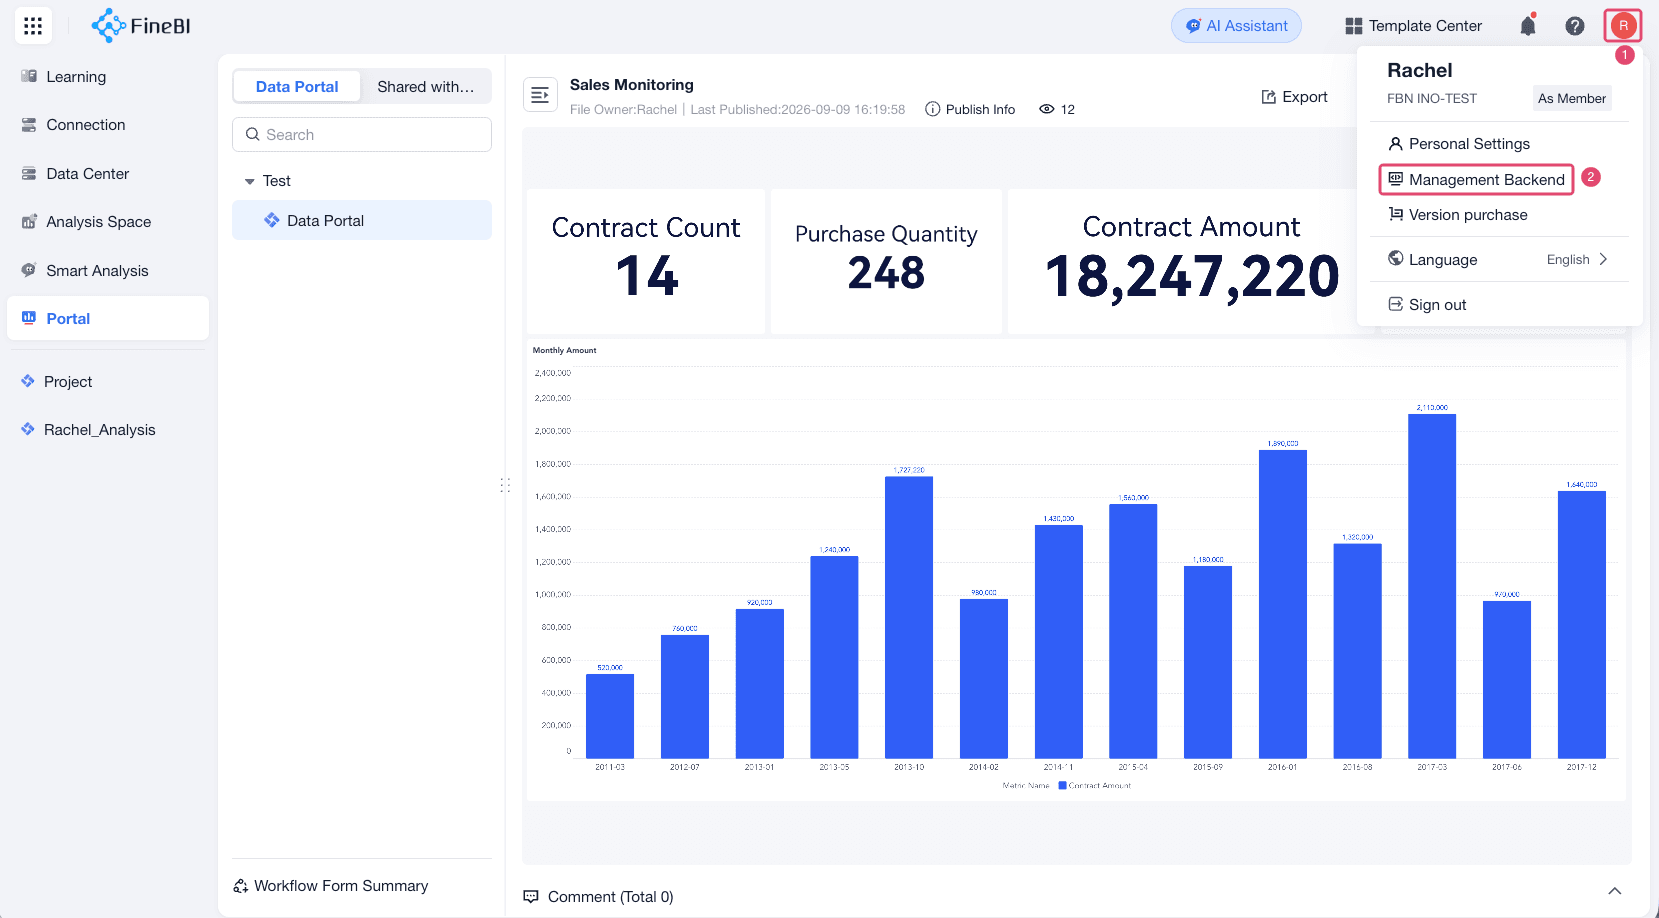 |
Plans and Capacity
Available features, user seats, and capacity depend on your FineBI Cloud plan. If your organization is using a trial or paid plan, review plan information in Management Backend or contact your account team for details.
Common Use Cases
| Team | Use Cases |
|---|---|
| Sales | Track performance, manage orders, monitor inventory, and analyze sales from multiple dimensions. |
| Finance | Import financial data, calculate financial metrics, document calculation logic, create reports, and share results securely. |
| HR | Analyze compensation, attendance, workforce structure, turnover, and recruiting data. |
Next Steps
- Start your first analysis