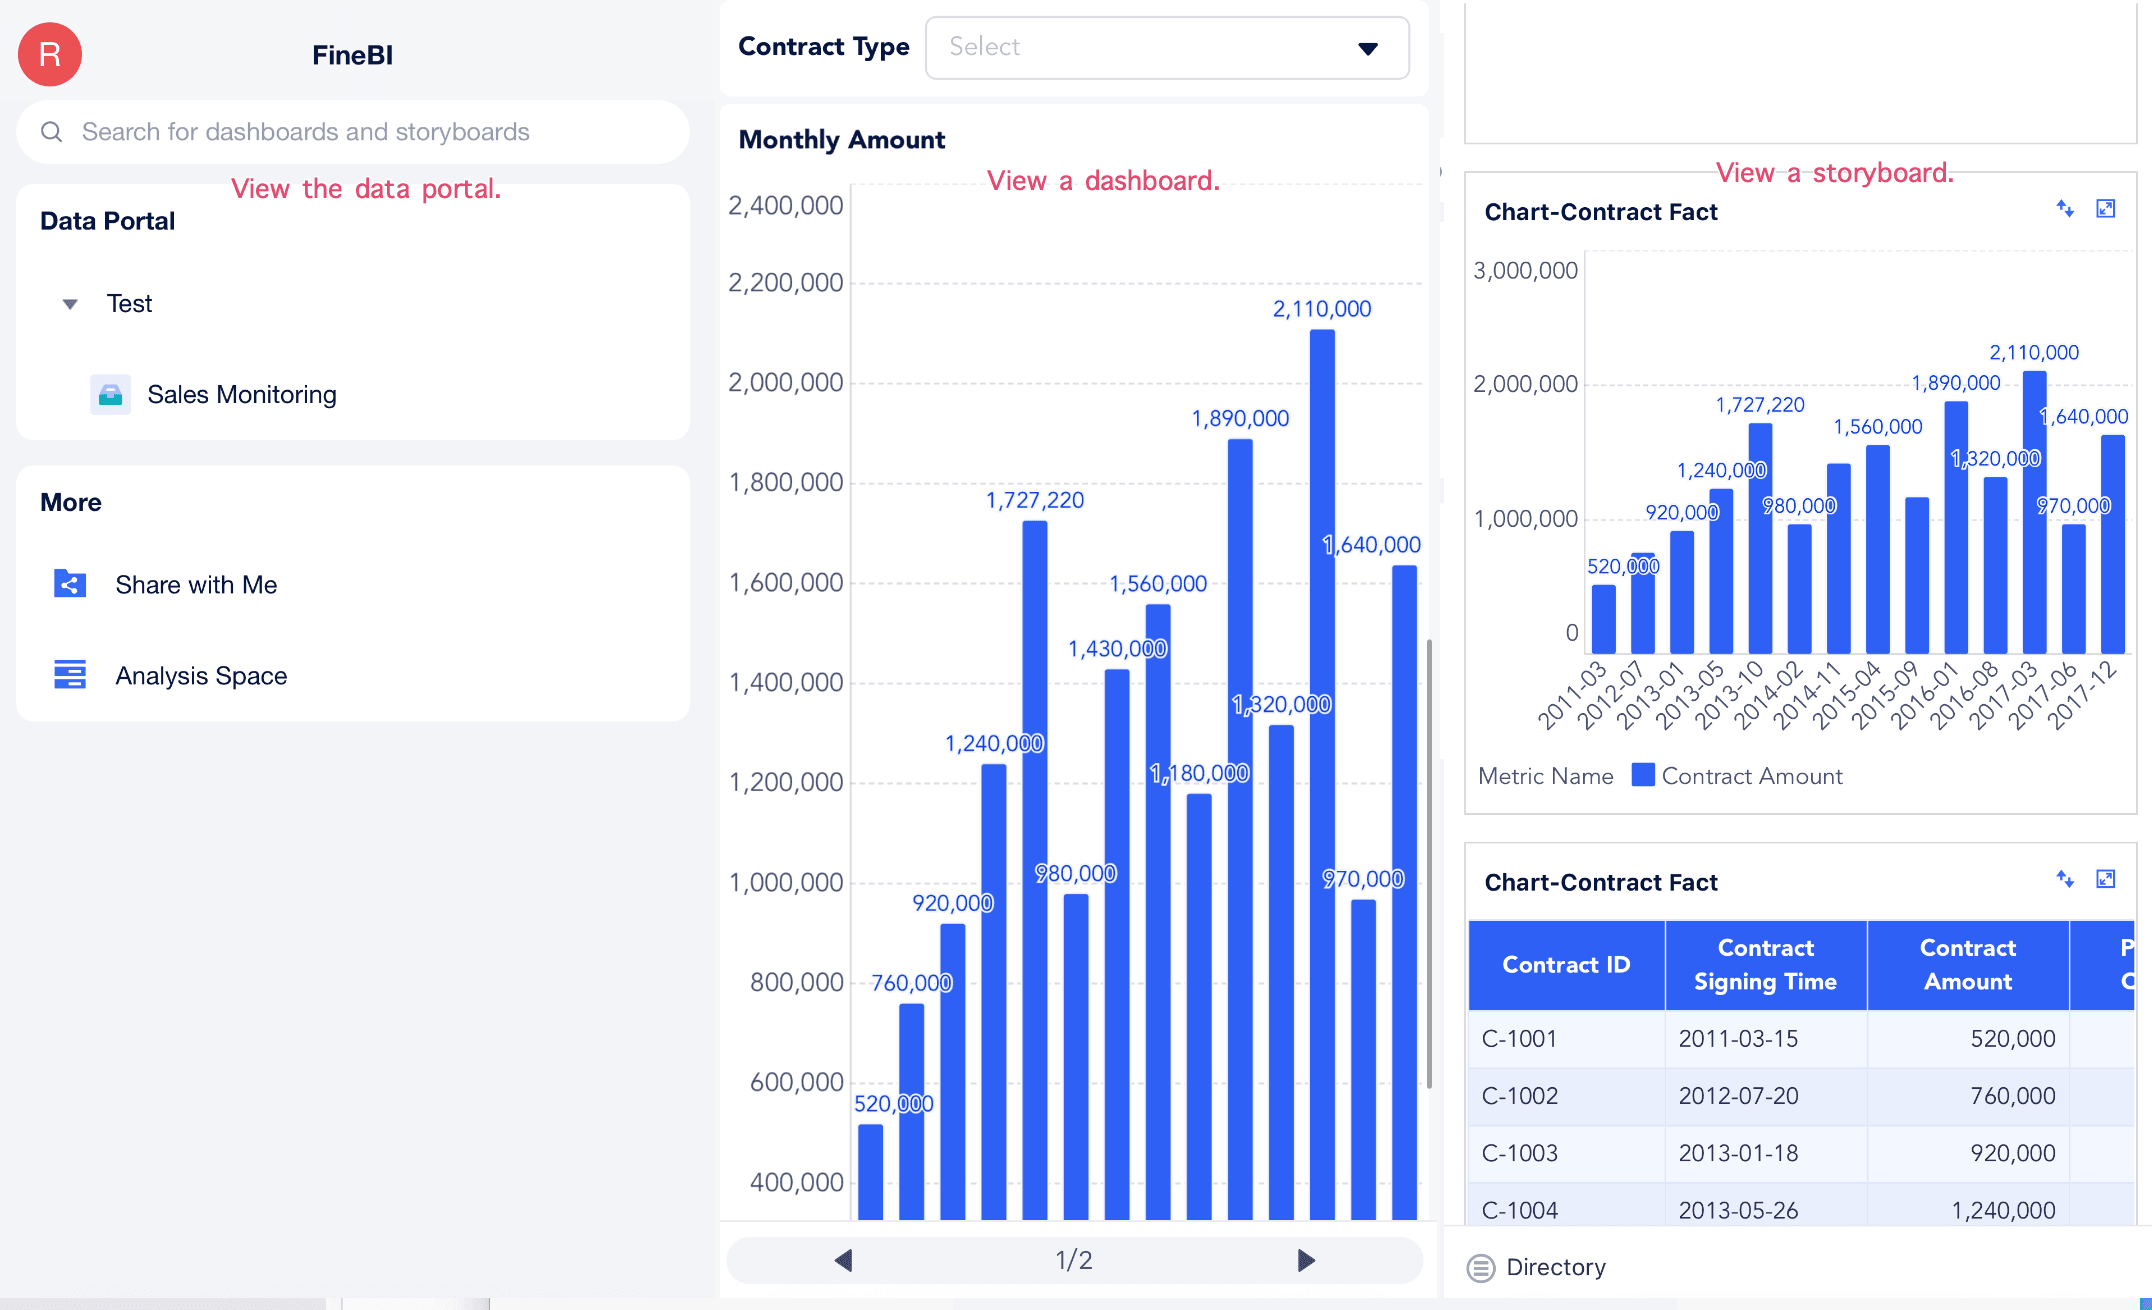
Use this document to learn how to view dashboards, storyboards, and analysis content in FineBI Next as a viewer.
Before You Start
- You have joined an organization.
- You are a viewer or are assigned viewing permissions.
- Your visible content depends on your organization, space, project, and content permissions.
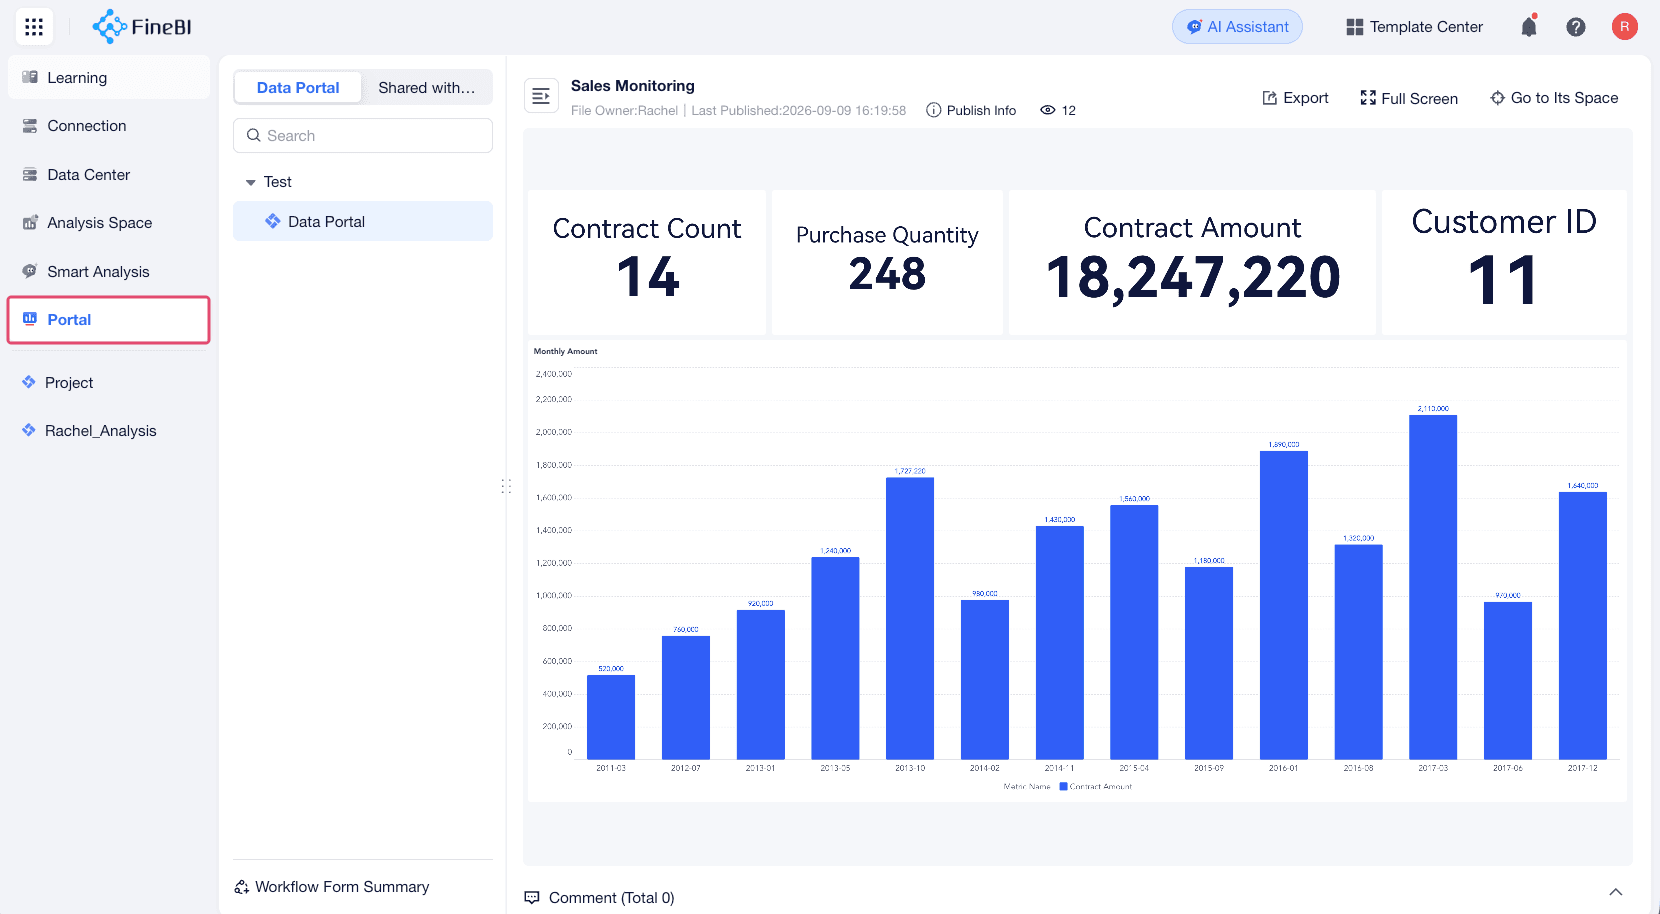
What Viewers Can Do
You can use FineBI Cloud to consume analysis results and explore shared data content.
| Content Type | What You Can Do |
|---|---|
| Data Portal | View dashboards, storyboards, and analysis tables organized by project that you have permission to access. |
| Dashboard | View charts, use interactions such as filters, linked analysis, and drill-down, and export data if you have permission to access corresponding spaces. |
| Analysis table | View processed analysis data and export result data if permitted. |
| Storyboard | View data stories and export chart data if permitted. |
| Mobile | View dashboards and storyboards on supported mobile devices. |
Viewing Content in Data Portal
Use Data Portal to find analysis content that is available to you.
Data Portal can be used as a dashboard center to display projects from different spaces. Members in different spaces may see different portal content based on permissions.
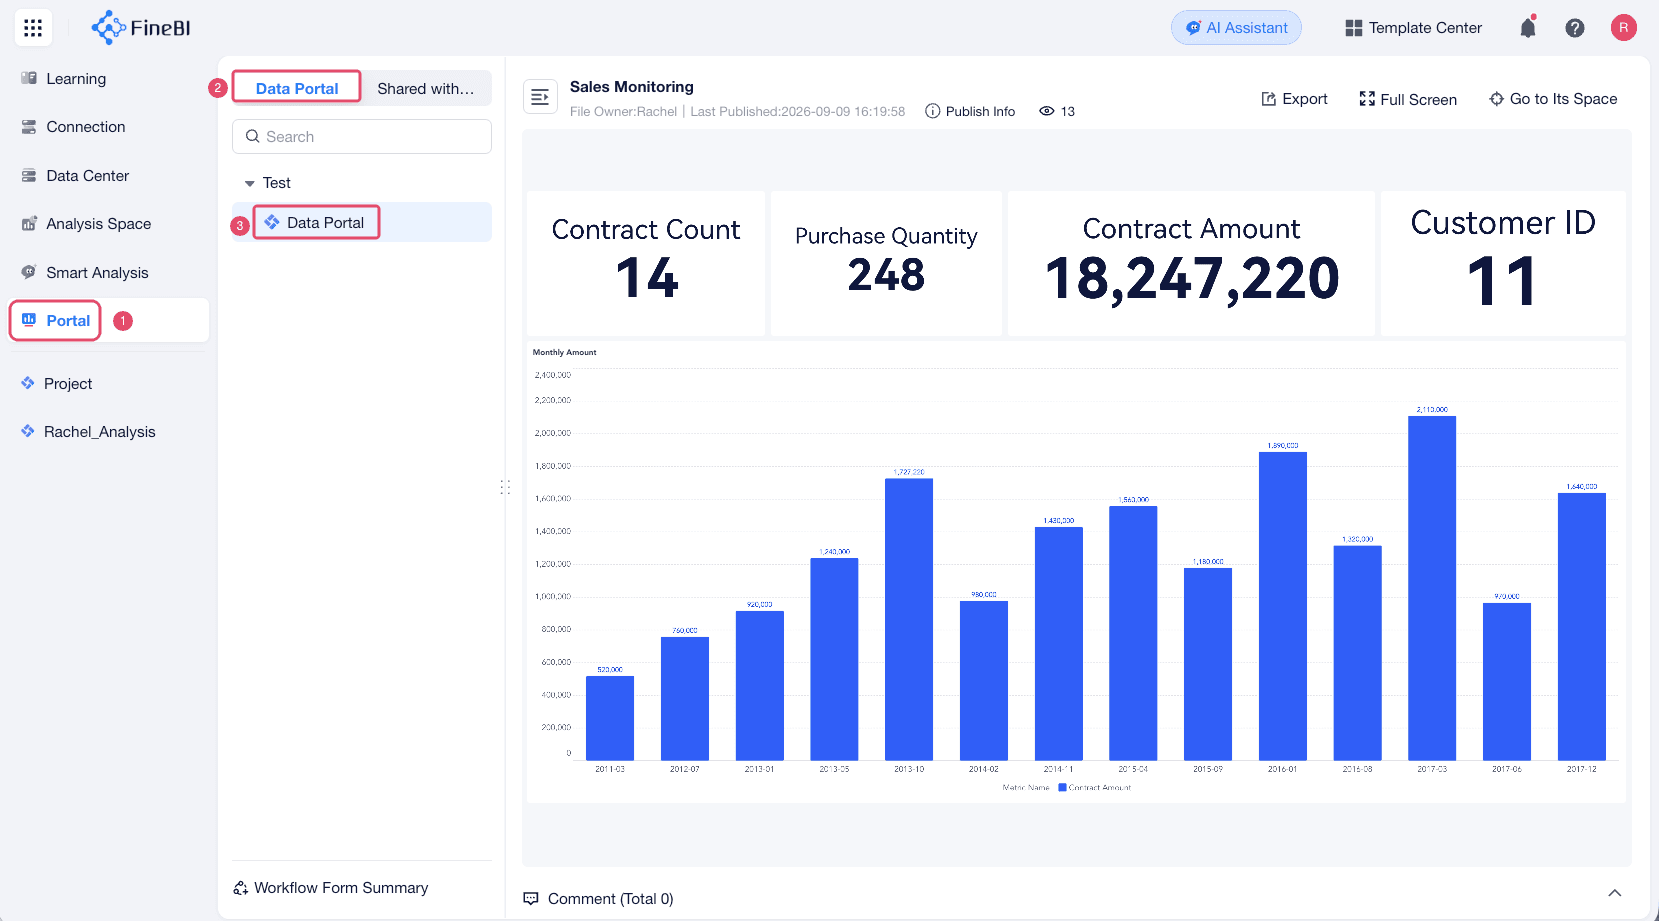
- Choose Portal > Data Portal.
- Click a project and view the mounted files within the project that you have permission to access.
Mounted files are organized by project. A project can include analysis tables, dashboards, and storyboards.
Viewing Shared Content
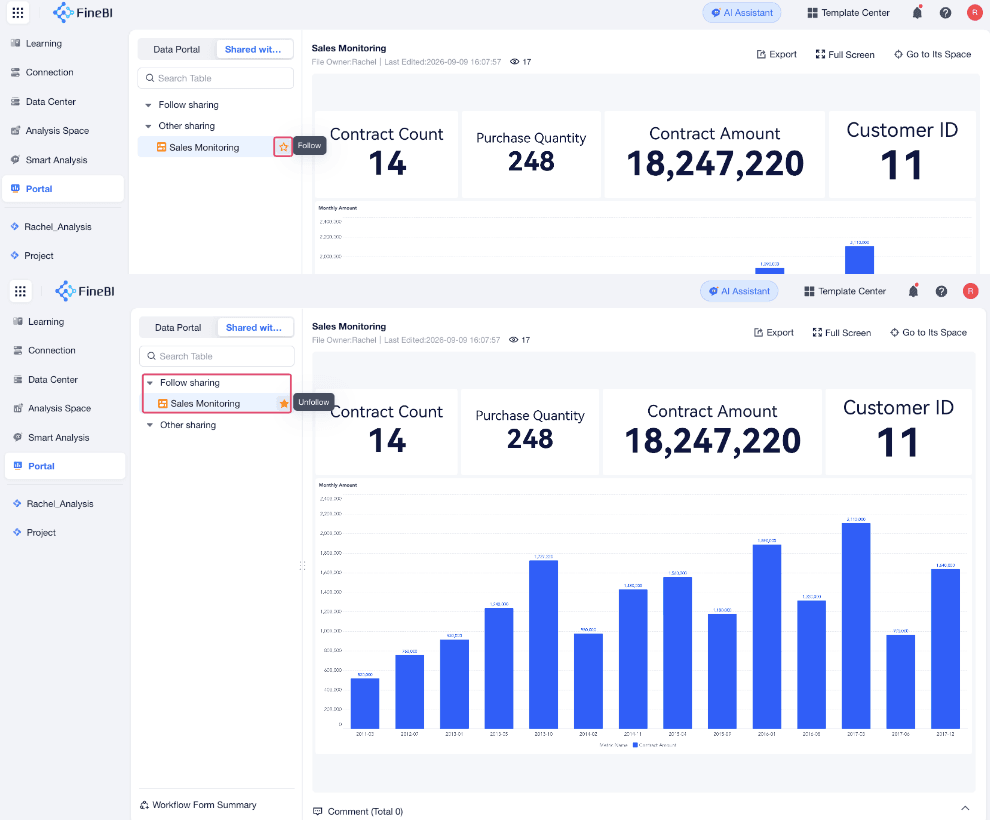
Use Shared with Me to find dashboards and storyboards that other members have shared with you inside the organization.
- Choose Portal > Shared with Me.
- Search for a shared dashboard or storyboard if needed.
- Open the content you want to view.
Shared dashboards and storyboards are placed in Other sharing automatically. You can follow frequently viewed dashboards. Followed content is moved to Follow sharing.
Viewing Dashboards
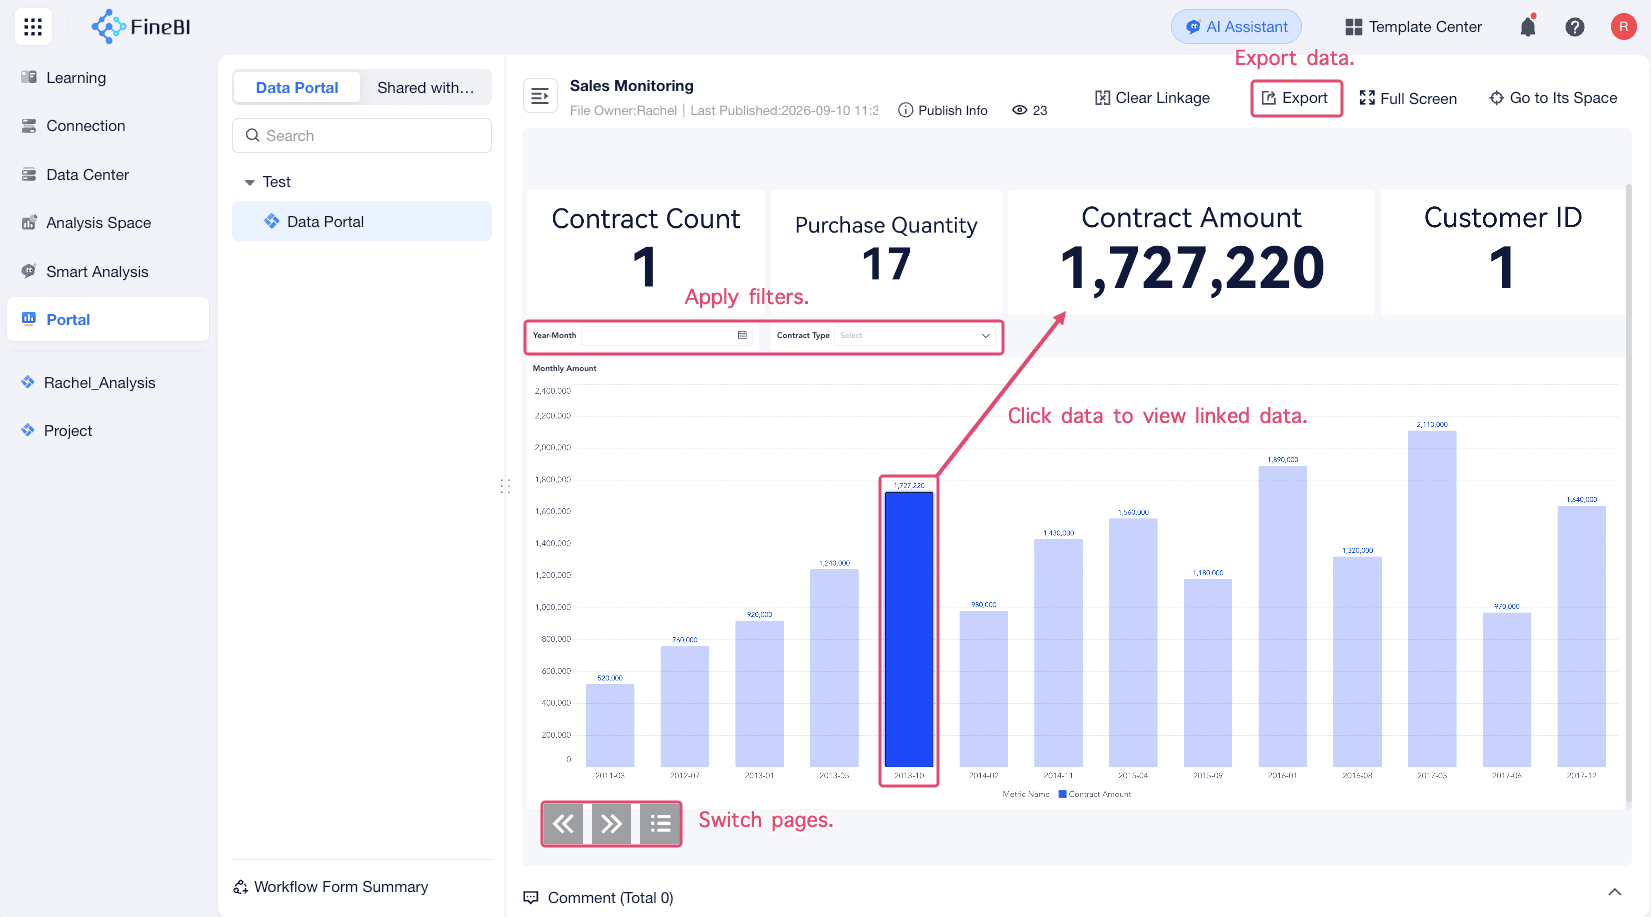
Dashboards combine charts and interactive components. Use them to monitor metrics, compare results, and explore changes in data.
- Open a dashboard from Data Portal or Shared with Me.
- Use available filters, linked analysis, drill-down, or other interactions to explore the data.
- Switch pages in the dashboard if the dashboard has multiple pages to view more data.
- Export dashboard data or chart data if you have permission.
Viewing Analysis Tables
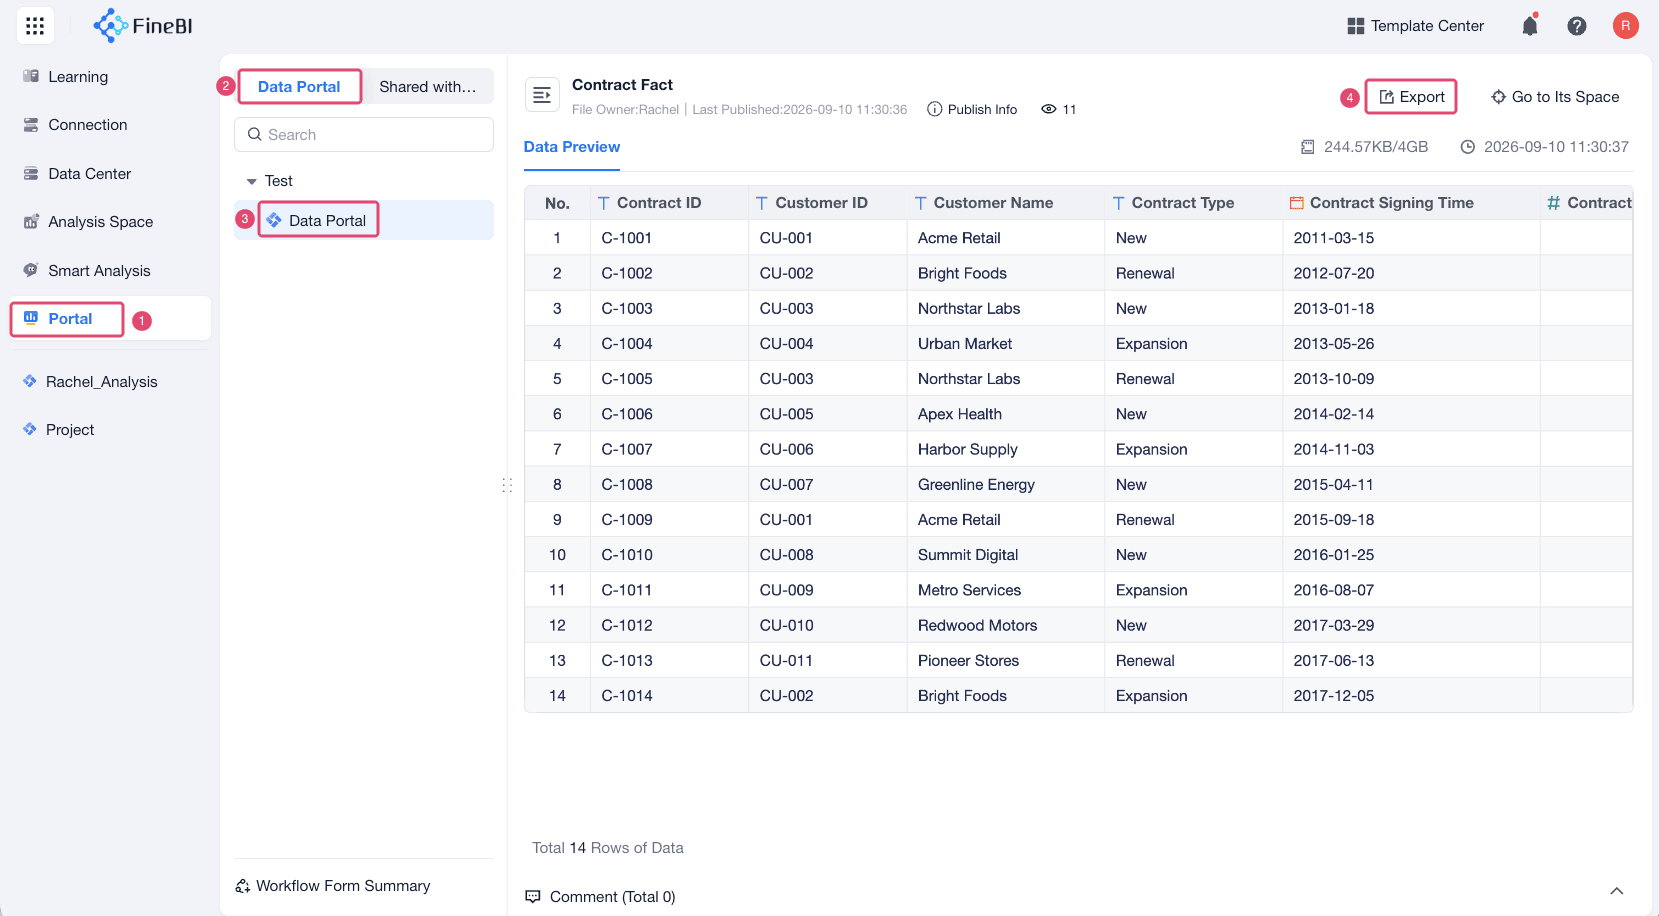
An analysis table contains prepared and processed data, serving as the data basis for charts, dashboards, and storyboards.
- Choose Portal > Data Portal.
- Open a project that you have permission to view.
- Open an analysis table.
- Export result data if you have permission.
Viewing Storyboards
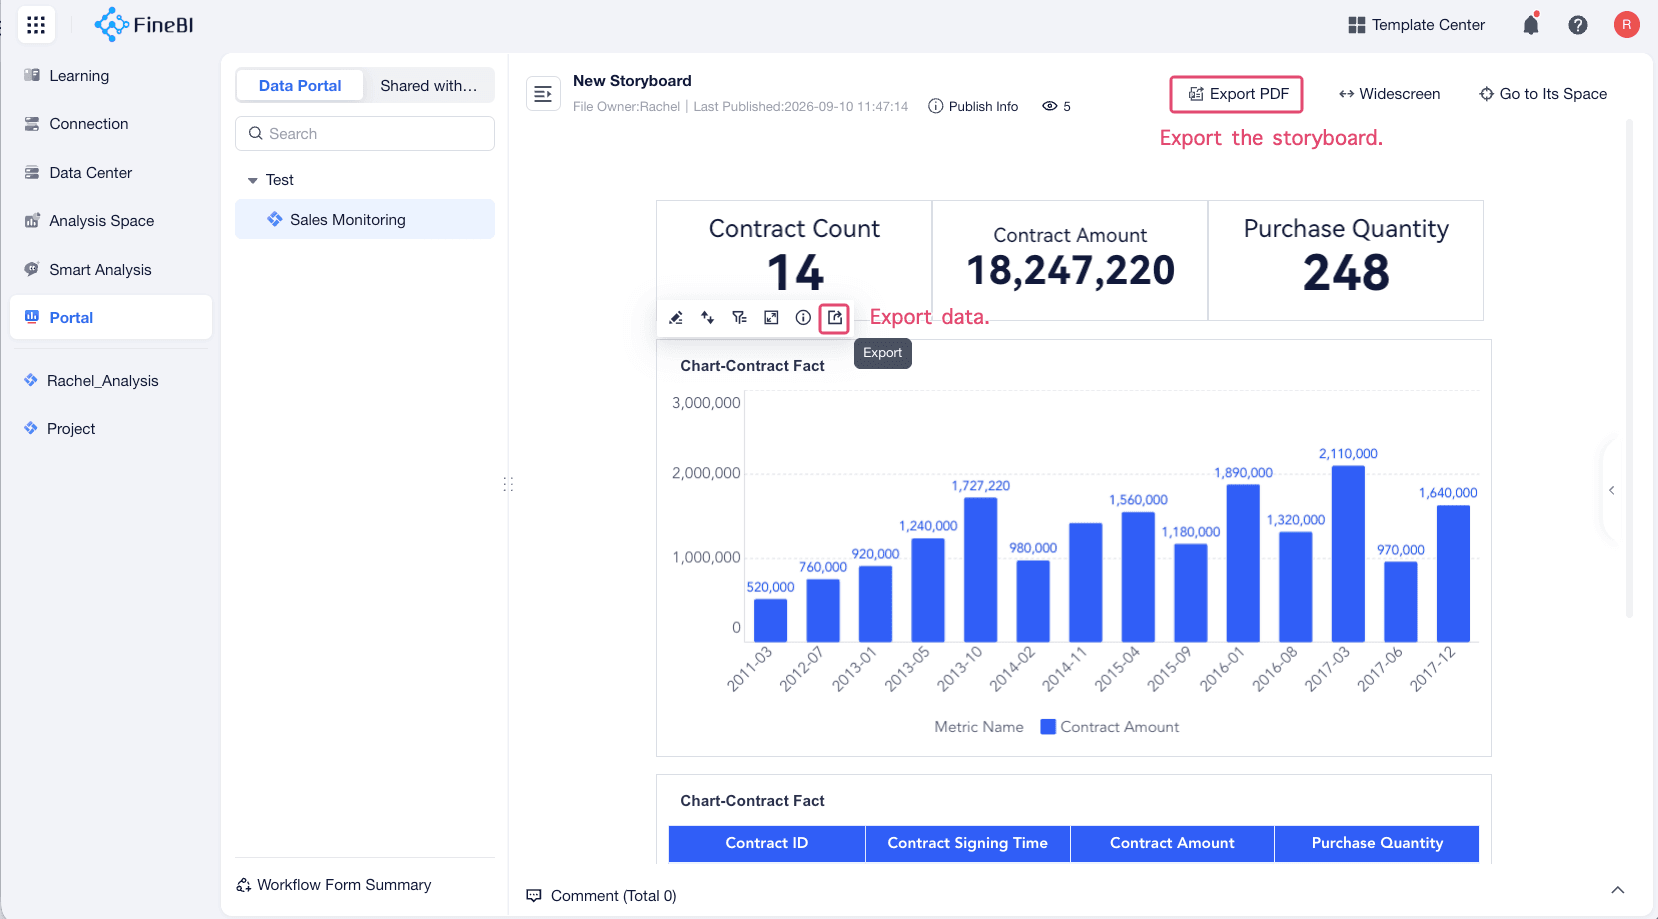
A storyboard explains analysis logic, processes, and conclusions with text, charts, images, and tables.
- Open a storyboard from Data Portal or Shared with Me.
- Review the analysis narrative and referenced charts.
- Export chart data from the storyboard or export the entire storyboard if you have permission.
Viewing on Mobile
You can view dashboards and storyboards on supported mobile devices.
- Open FineBI Cloud on a supported mobile device.
- Log in to your organization.
- Open the project or shared content that you have permission to view.
- View dashboards or storyboards on mobile.