Function Description
| Category | Description |
|---|---|
| Syntax | VAR.P(number) |
| Function | Returns the variance of the number values for the current analysis dimension. |
| Parameter | number: the numeric values used to calculate the variance |
| Number of Parameters | 1 |
| Parameter Type | Number |
| Return Value Type | Number |
| Notes | Aggregate functions can be used only when you add a metric to a chart. They cannot be used in analysis tables. |
Examples
When the date field in Row Dimension is set to day granularity, the metric VAR.P([Sales Volume]) returns the variance of sales volume for each day.
When the date field in Row Dimension is set to month granularity, the metric VAR.P([Sales Volume]) returns the variance of sales volume for each month.
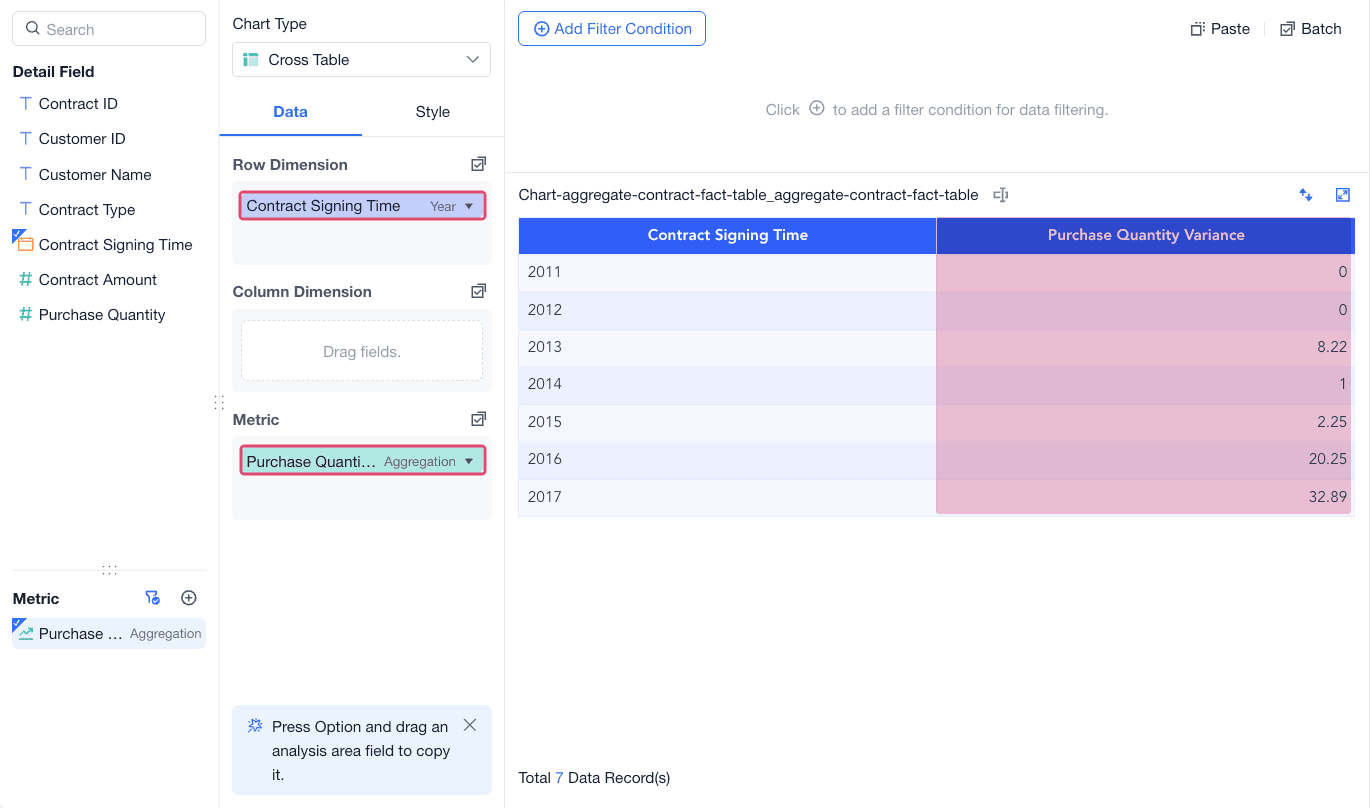
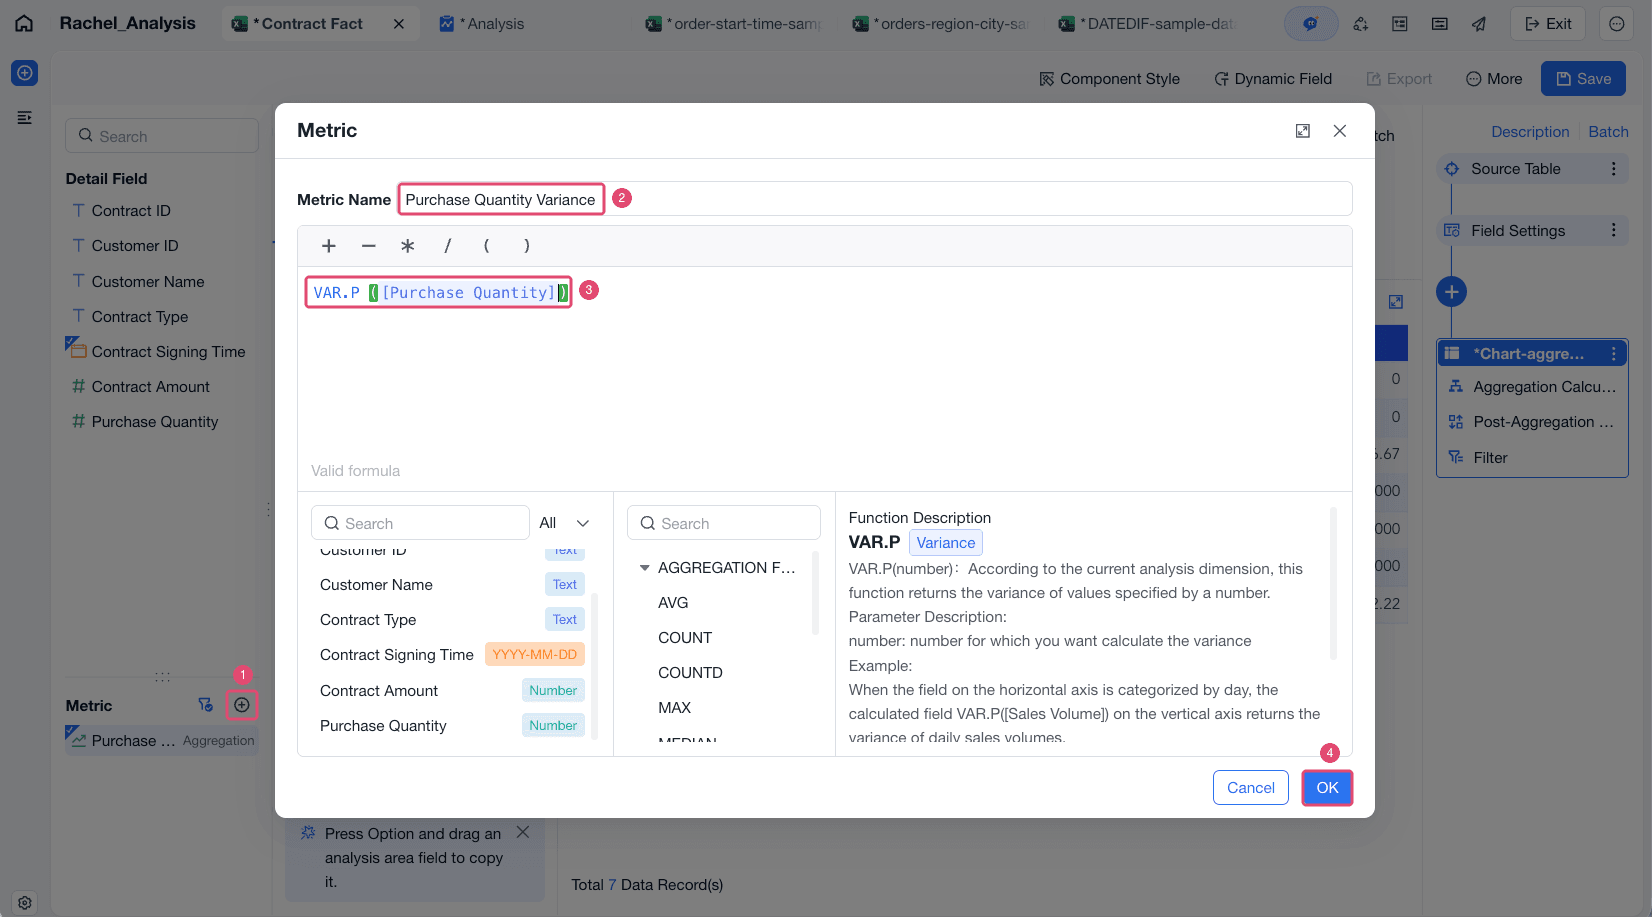
To calculate the variance of Purchase Quantity for each year, use the formula VAR.P([Purchase Quantity]).
Drag Contract Signing Time to Row Dimension, set it to year granularity, and then drag Purchase Quantity Variance to the Metric area.