


Function Description
| Category | Description |
|---|---|
| Syntax | PERCENTILE.INC(number,k) |
| Function | Sorts all number values in ascending order and returns the value at the specified percentile. |
| Parameters | number: the array or range of data that defines relative standing k: the percentile value The k value must be a numeric constant between 0 and 1, inclusive. |
| Number of Parameters | 2 |
| Parameter Type | number: number k: number |
| Return Value Type | Number |
| Notes | Aggregate functions can be used only when you add a metric to a chart. They cannot be used in analysis tables. |
Examples
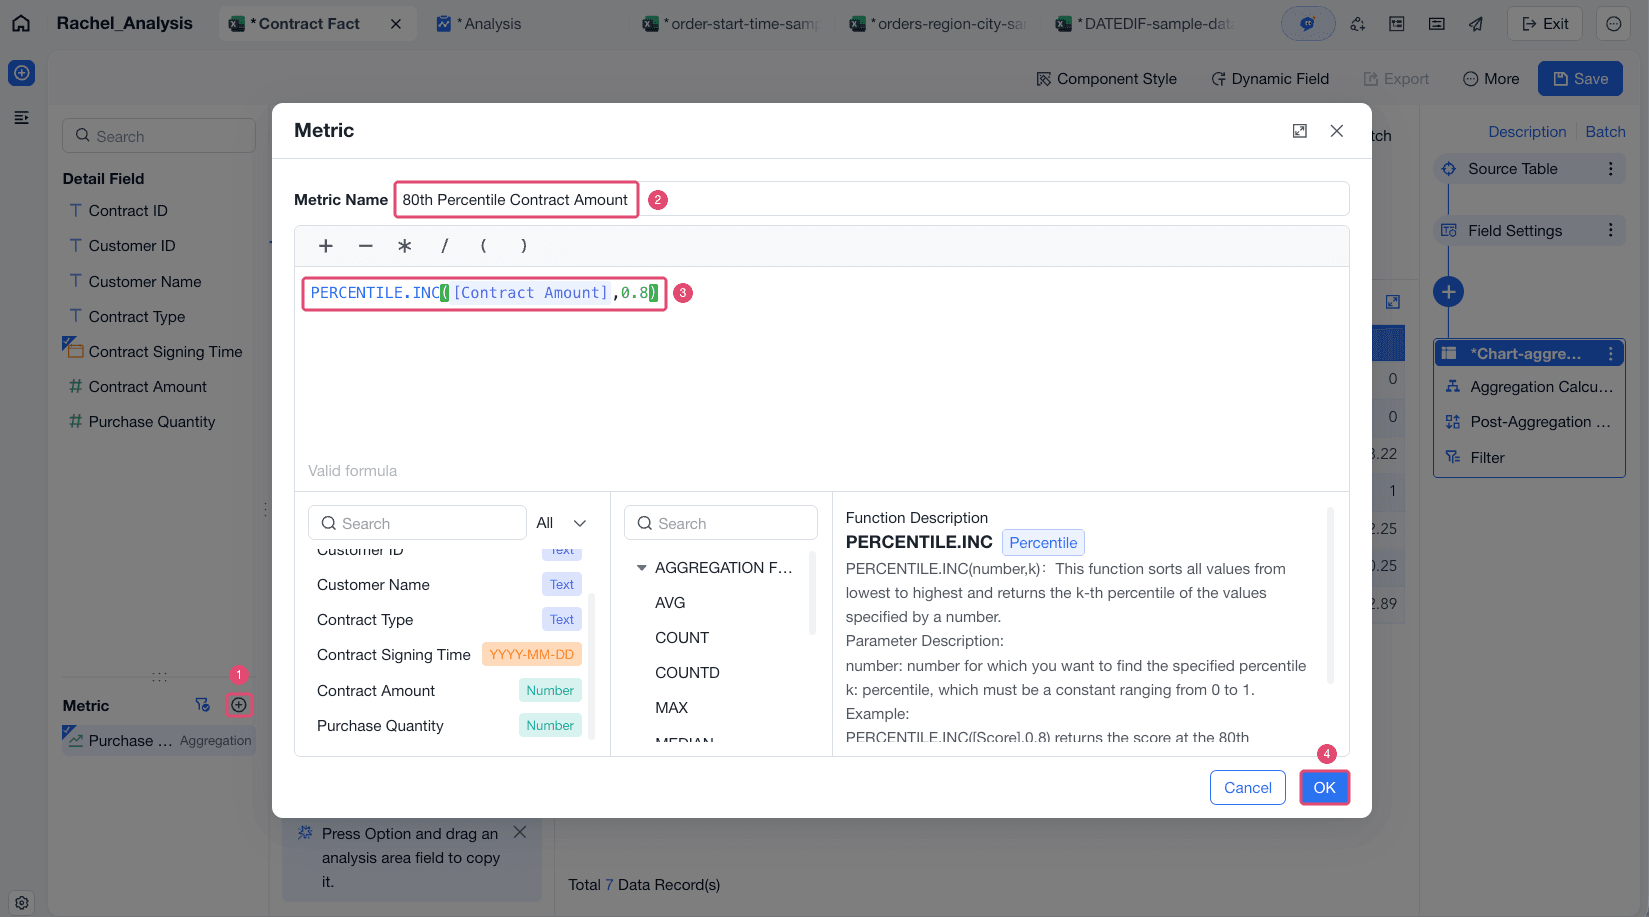
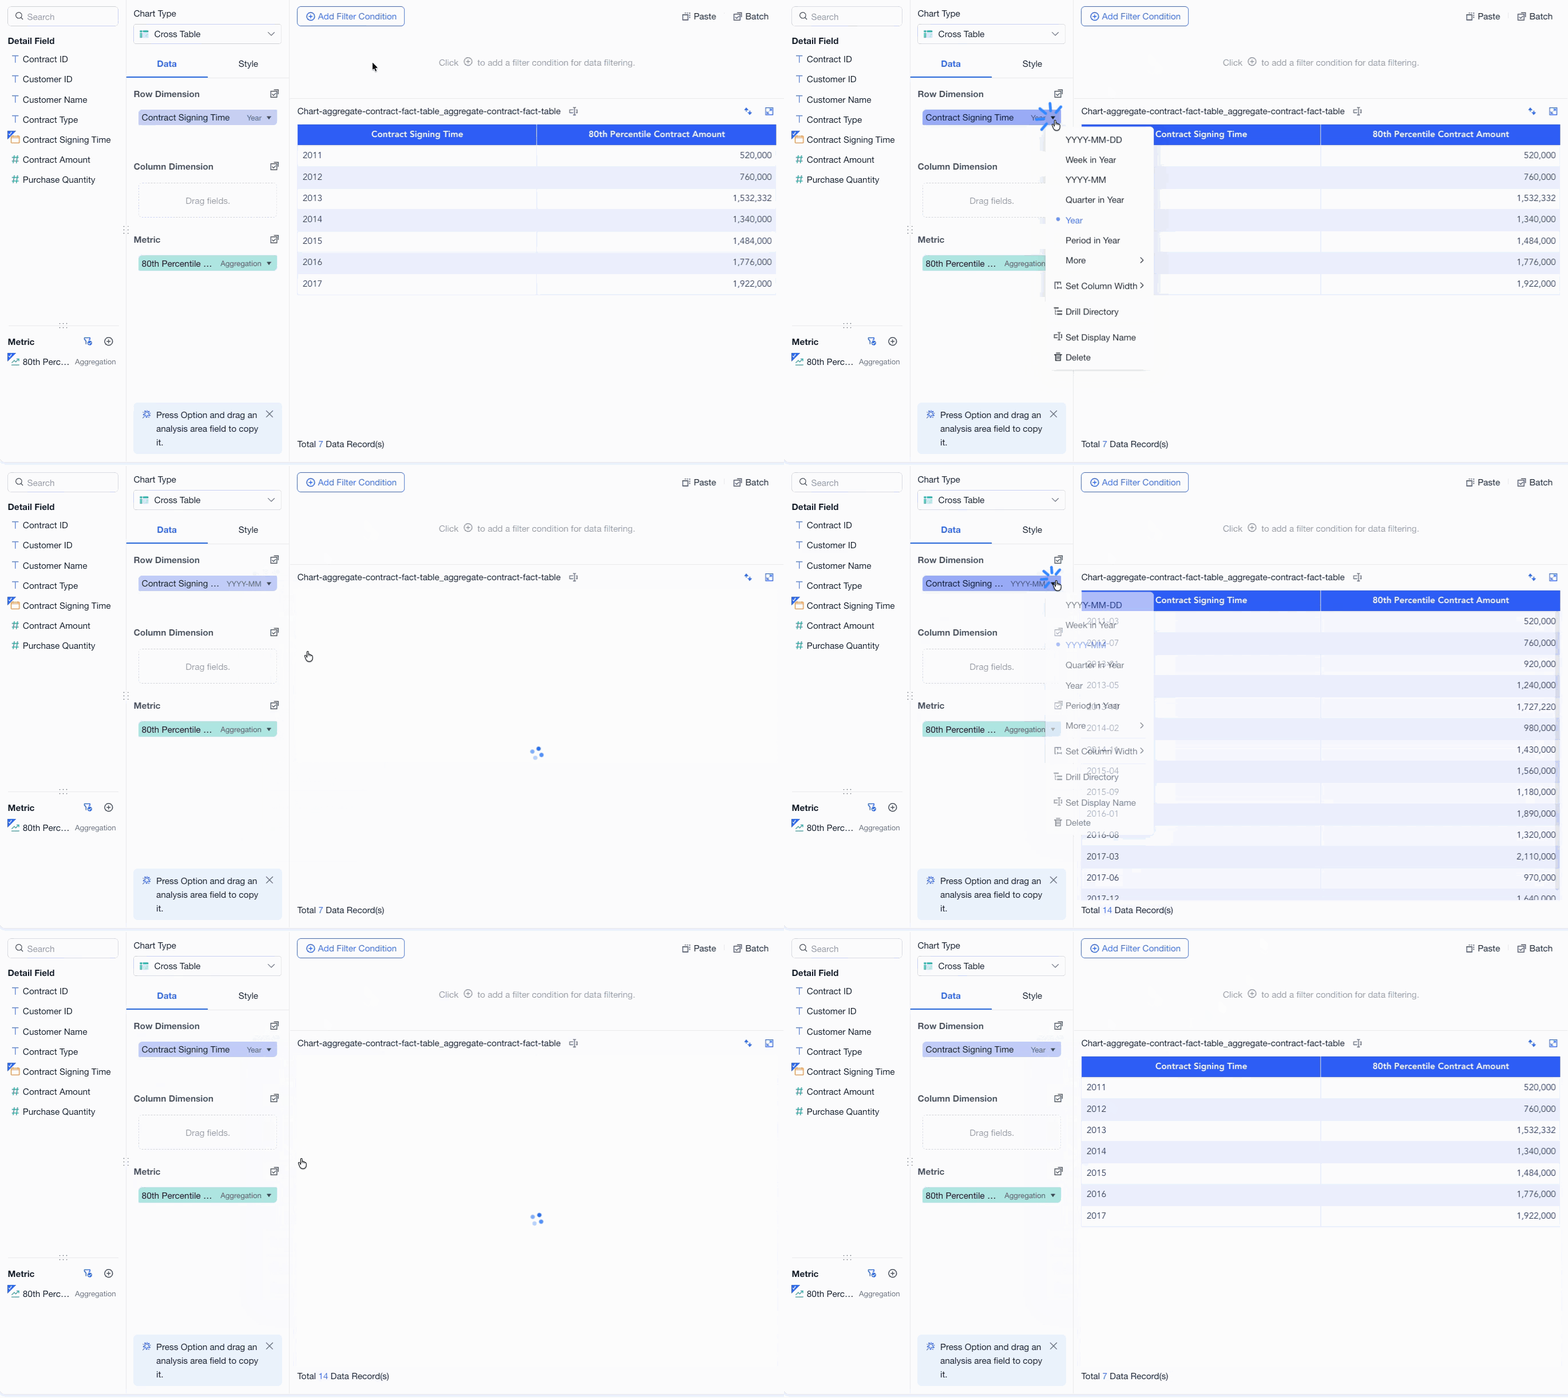
When the date field in Row Dimension is set to year granularity, the metric PERCENTILE.INC([Contract Amount],0.8) returns the 80th percentile contract amount for each year.
When the date field in Row Dimension is set to month granularity, PERCENTILE.INC([Contract Amount],0.8) returns the 80th percentile contract amount for each month.
 More Examples
If you are an HR manager, you can use PERCENTILE.INC to understand employee salary distribution.
| Formula | Meaning | Description |
|---|---|---|
PERCENTILE.INC([Salary],0.25) | Returns the salary value at the 25th percentile. | 25% of employees have salaries below this value. Use it to understand the lower salary range. |
PERCENTILE.INC([Salary],0.5) | Returns the salary value at the 50th percentile. | 50% of employees have salaries below this value. This is the midpoint of the salary distribution. |
PERCENTILE.INC([Salary],0.9) | Returns the salary value at the 90th percentile. | 90% of employees have salaries below this value. Use it to understand the high salary range. |